
Giving gifts is one of the most popular ways Americans intend to celebrate Christmas, but that doesn’t mean all presents are appreciated. Amid rising living costs, giving the wrong gifts is more expensive and frustrating than ever. Read on to see what NOT to buy for your family and friends this holiday season.
Quick overview
- America’s most unwanted gifts include plants, beauty products, and drinks.
- 56.60% of Americans will regift or donate unwanted gifts, while 42.34% choose to return or exchange them for something they like.
- Women’s least favorite gifts are liquor or drinks, while men’s least favorite gifts are beauty products.
- The worst person to give these unwanted gifts would be the significant other/partner.
- Unwanted gifts: Avoid buying plants and beauty products
- Common reasons behind the unwanted gifts
- What do Americans do with their unwanted gifts?
- Unwanted gifts: Partner is the worst giver
- Do Americans actually address the “unwanted” part?
- Unwanted gifts by gender
- Unwanted gifts by age
- Holiday gifts and spending statistics
- What retailers should do to prepare for uncertainty
Unwanted gifts: Avoid buying plants and beauty products
Flowers and plants top the list when it comes to America’s most unwanted gifts (42.42%), followed by beauty products (40.29%). Americans also don’t want liquor or drinks as gifts (34.31%).
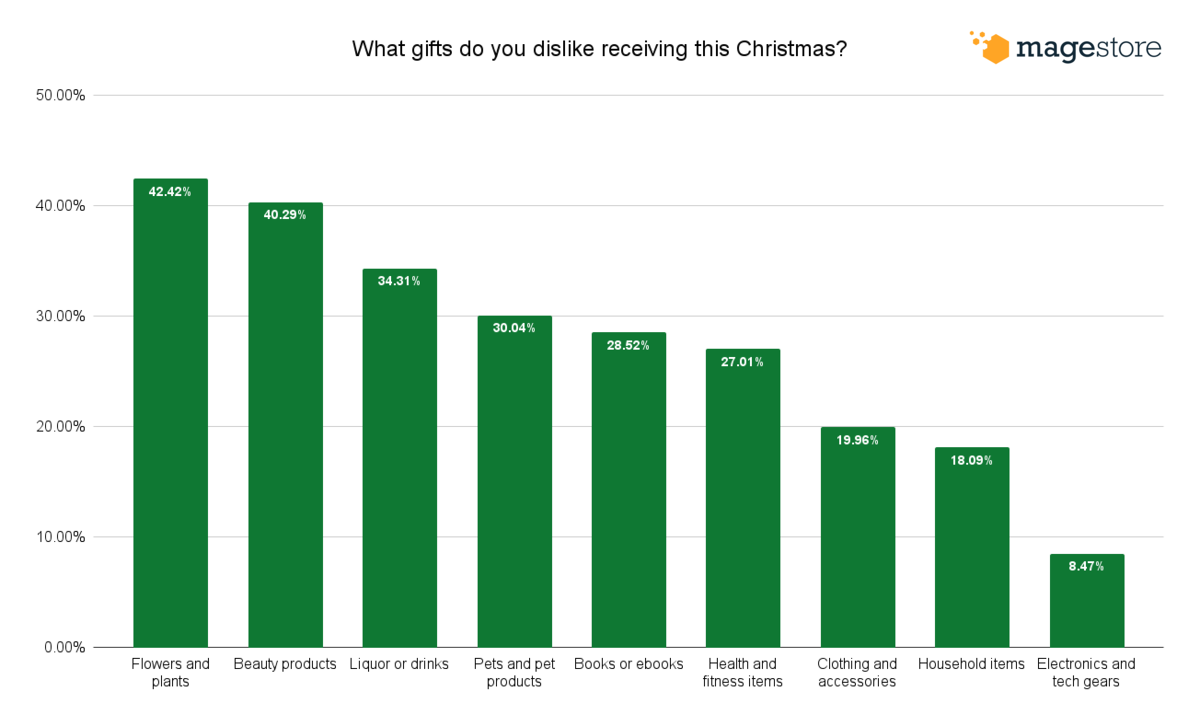
Types of gift | Number of responses | Percentage |
Flowers and plants | 476 | 42.42% |
Beauty products | 452 | 40.29% |
Liquor or drinks | 385 | 34.31% |
Pets and pet products | 337 | 30.04% |
Books or ebooks | 320 | 28.52% |
Health and fitness items | 303 | 27.01% |
Clothing and accessories | 224 | 19.96% |
Household items | 203 | 18.09% |
Electronics and tech gears | 95 | 8.47% |
Americans aren’t the only ones who might dislike beauty products. A 2017 survey by Finder revealed the U.K.’s least favorite gifts are clothing, cosmetics, and household items.
Unsure what your friends and family members want? Electronics and tech gears are your safest bet, with only 8.47% of participants citing them as their least favorite.
Common reasons behind the unwanted gifts
More than half (52.41%) of the survey participants won’t like a certain gift if it’s not useful to them, and 50.27% don’t want gifts that don’t fit their taste.
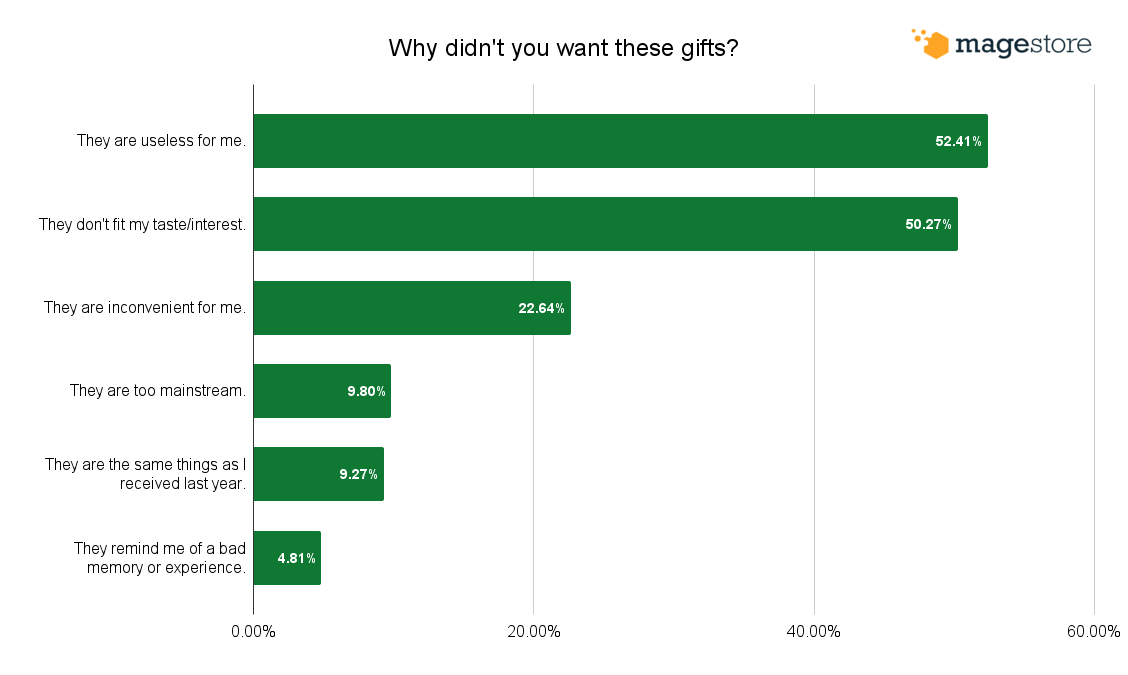
Reason | Number of responses | Percentage |
They are useless for me. | 588 | 52.41% |
They don't fit my taste/interest. | 564 | 50.27% |
They are inconvenient for me. | 254 | 22.64% |
They are too mainstream. | 110 | 9.80% |
They are the same things as I received last year. | 104 | 9.27% |
They remind me of a bad memory or experience. | 54 | 4.81% |
When we combine this with the top 3 unwanted gifts, it’s clear Americans have specific personalized needs for these products.
Americans on average already spend $78 on Christmas trees and $100 on decorations, so it’s not a good idea to gift plants that clash with your friend’s home design or clutter up their houses.
With beauty products, shoppers will stick with products that work for them. Cosmetics items have expiry dates, so they will only buy things that they’re running out of.
Liquor and drinks also depend on personal taste, and non-essential, non-food expenses are taking a backseat this year. 42% of Americans already intend to cut down spending on alcohol this Christmas.
With inflation affecting the Christmas plan of nearly 9 out of 10 Americans, the demands for practical and personalized gifts are on the rise.
What do Americans do with their unwanted gifts?
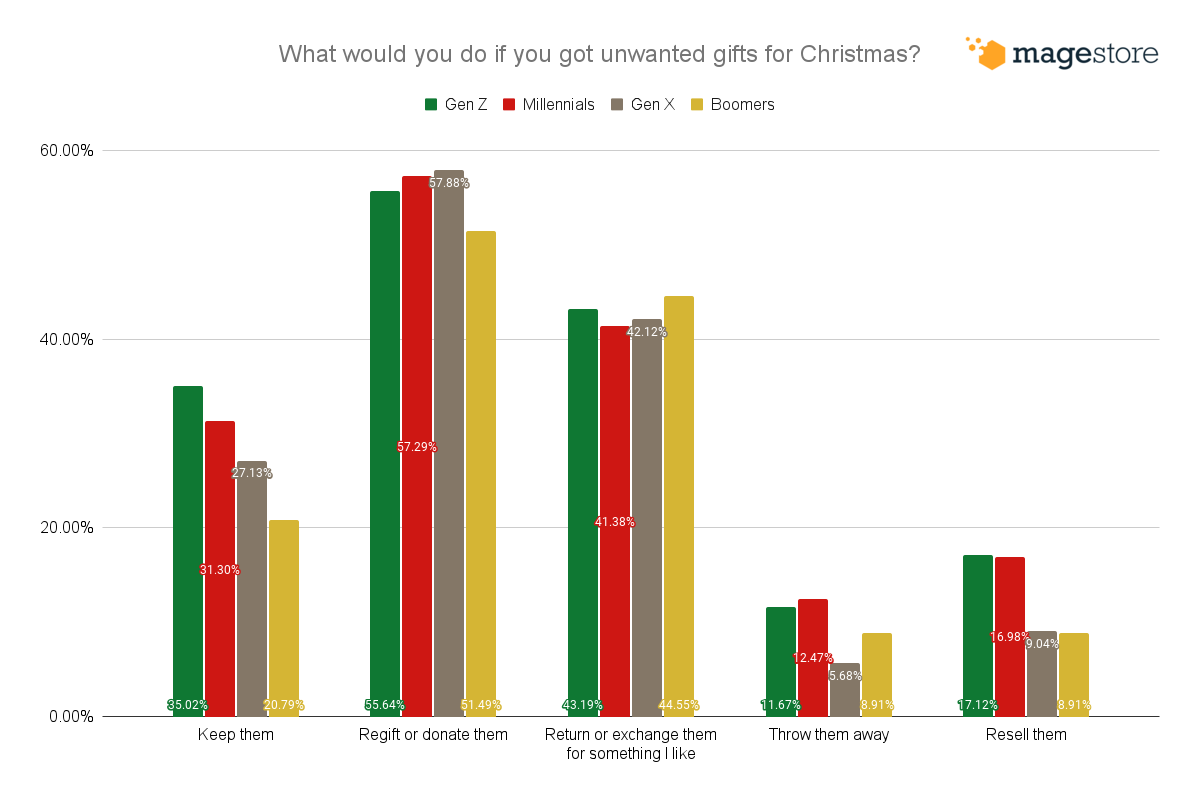
More than half (56.60%) of the Americans who received an unwanted gift choose to regift or donate them. The second most popular choice is to return or exchange the gift for something else they like (42.34%).
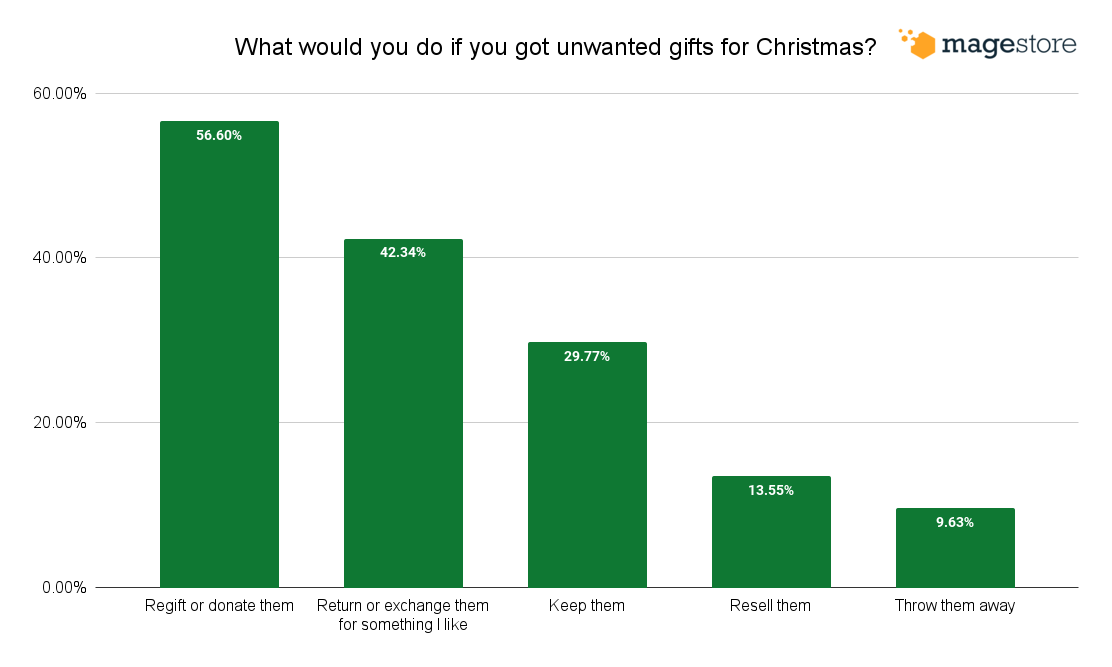
29.77% of participants opt to politely keep the gifts, while 13.55% have plans to resell them. Only 9.63% say they will throw the gifts away.
Unwanted gifts: Partner is the worst giver
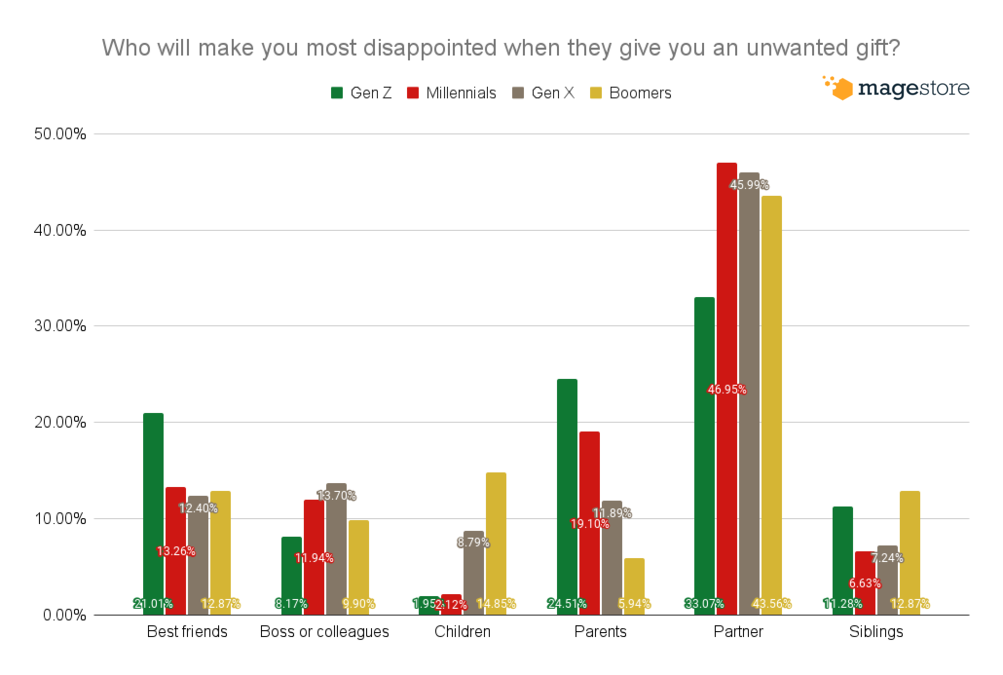
43.14% of the survey participants are most disappointed when the one giving the unwanted gift is their partner.
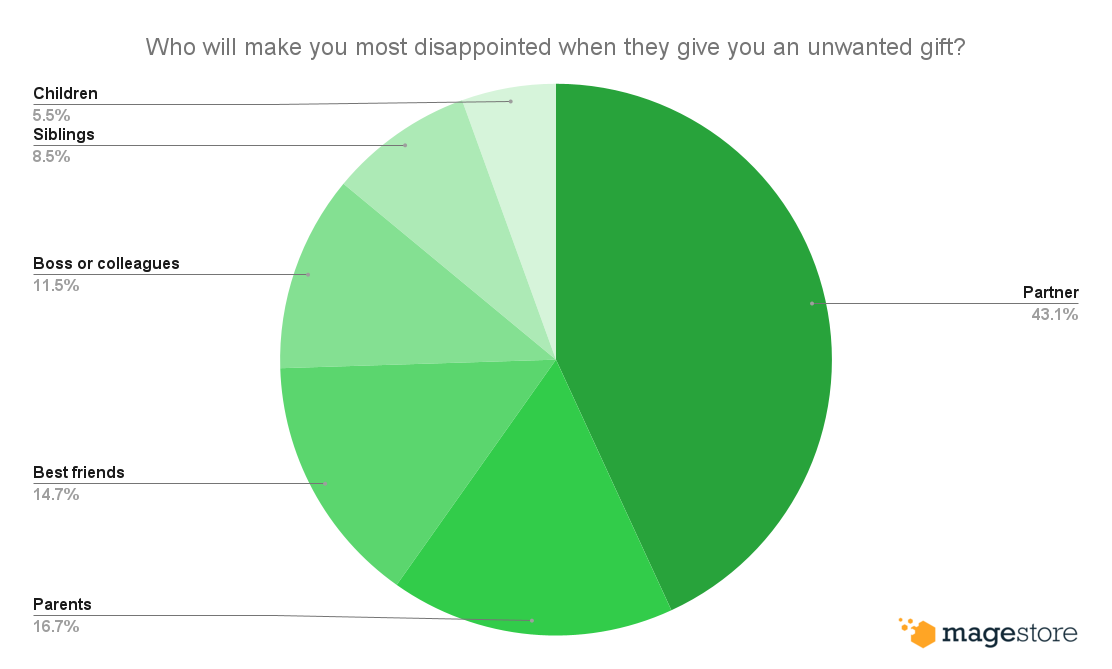
Parents and best friends are the second and third worst givers, cited by 16.67% and 14.71% of participants respectively. Only 11.50% consider their boss or colleagues the worst giver of unwanted gifts, and less than 10% will be most disappointed by unwanted gifts from siblings or their children.
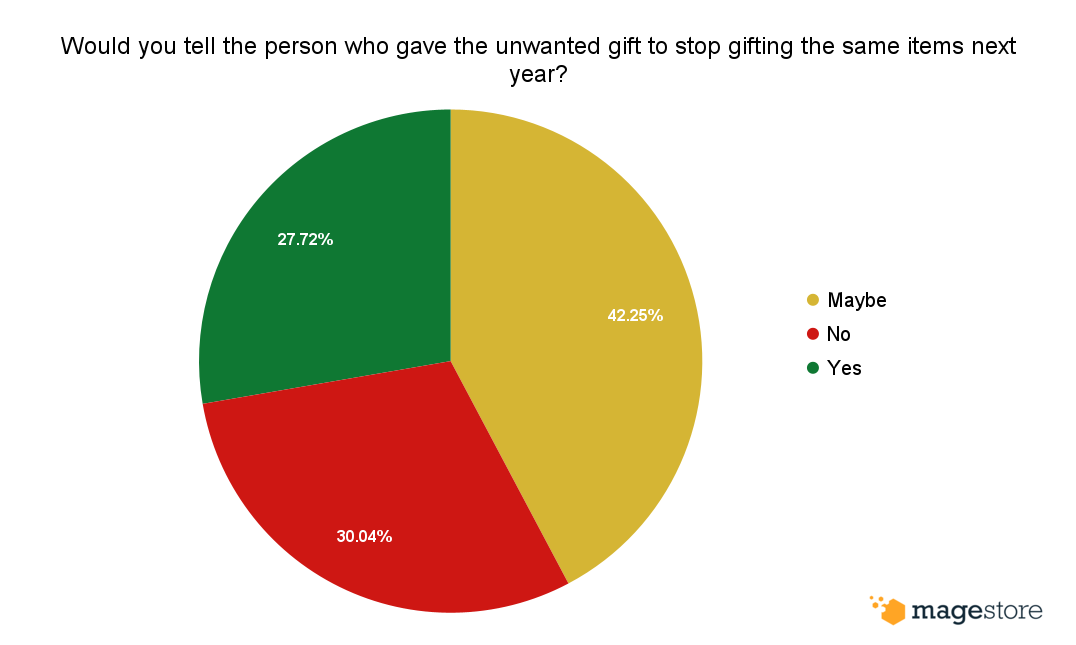
Do Americans actually address the “unwanted” part?
When asked if they would tell the person giving unwanted gifts to stop next year, only 27.72% of the participants are blunt enough to say yes. 42.25% say they may comment on the unwanted gifts, and 30.04% will say nothing. It’s the thoughts that count.
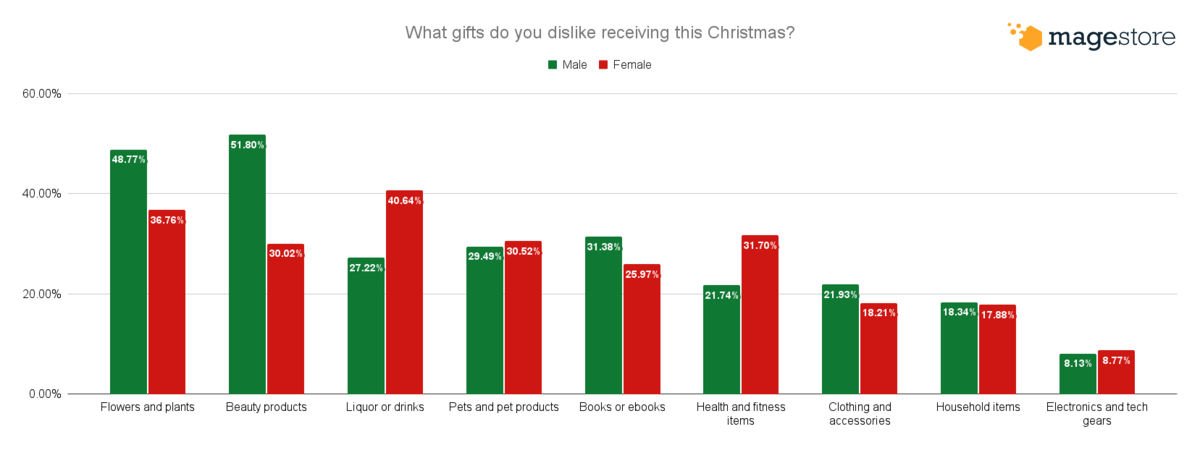
Unwanted gifts by gender
Most unwanted gifts
There’s quite a difference between men’s and women’s least favorite gifts. More than half the men listed beauty products as their most unwanted gifts (51.80%), followed by flowers and plants (48.77%), and books and ebooks (31.38%). Women’s most unwanted gifts are liquor or drinks (40.64%), flowers and plants (36.76%), and health and fitness products (31.70%).
Types of gift | Men | Women |
Flowers and plants | 48.77% | 36.76% |
Beauty products | 51.80% | 30.02% |
Liquor or drinks | 27.22% | 40.64% |
Pets and pet products | 29.49% | 30.52% |
Books or ebooks | 31.38% | 25.97% |
Health and fitness items | 21.74% | 31.70% |
Clothing and accessories | 21.93% | 18.21% |
Household items | 18.34% | 17.88% |
Electronics and tech gears | 8.13% | 8.77% |
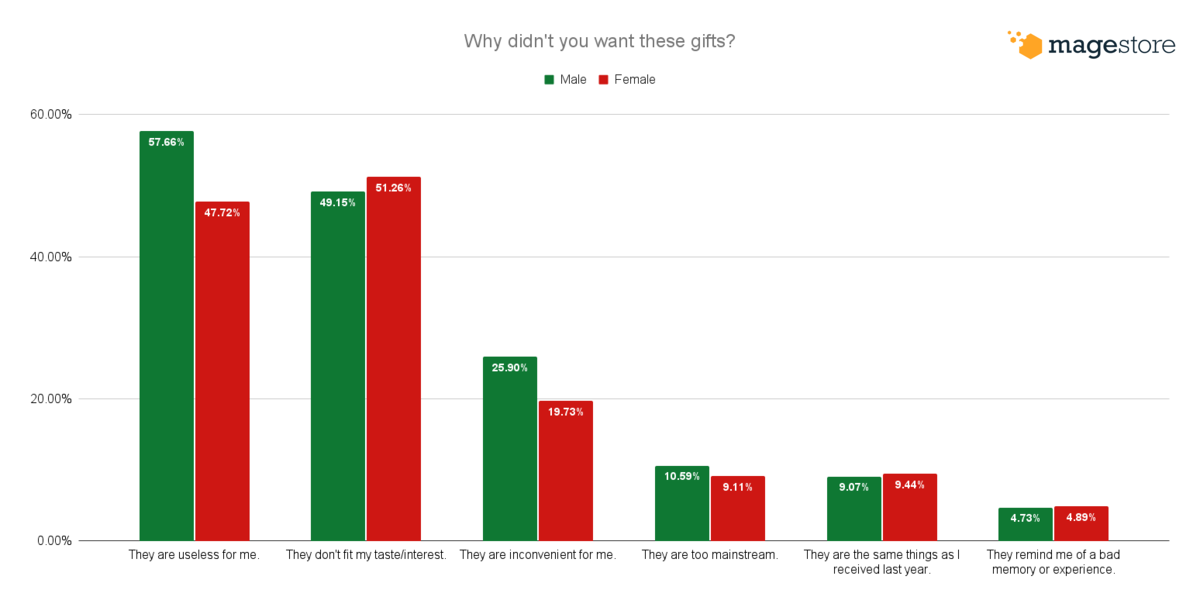
Reasons
When it comes to why these gifts are unwanted, women’s most common reason is that these items don’t fit their taste or interest (51.26%), while 57.66% of men say unwanted gifts are useless to them.
What men and women do with unwanted gifts
3 out of 5 women would regift or donate the unwanted item compared to 52.17% of men. On the other hand, men are 2 times more likely than women to throw away unwanted gifts, with the number being 13.04% and 6.58% respectively.
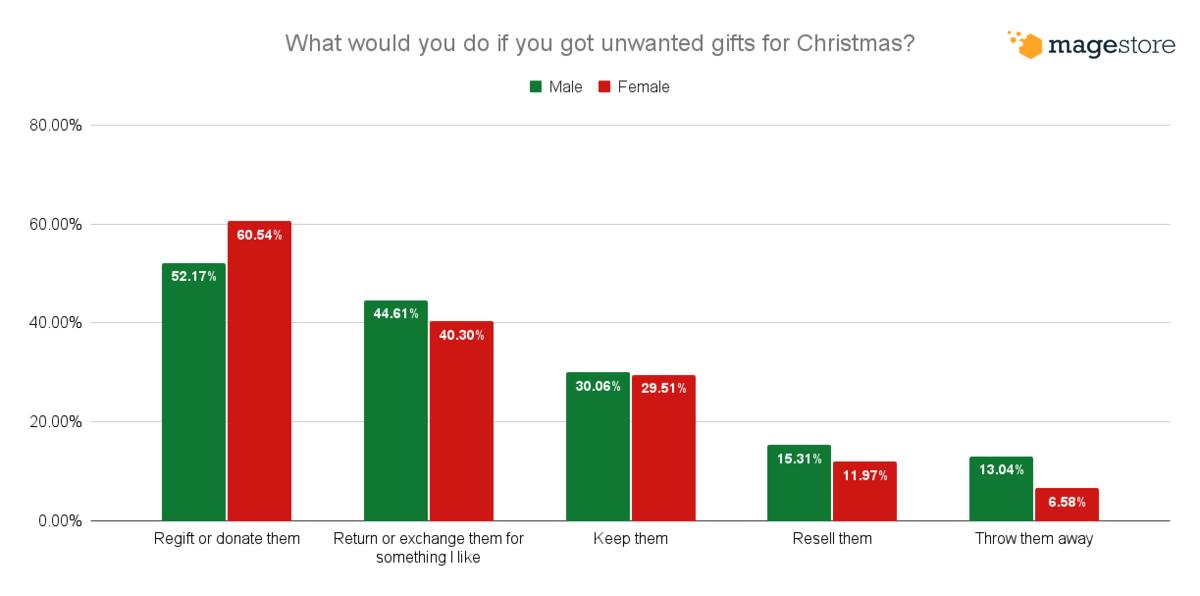
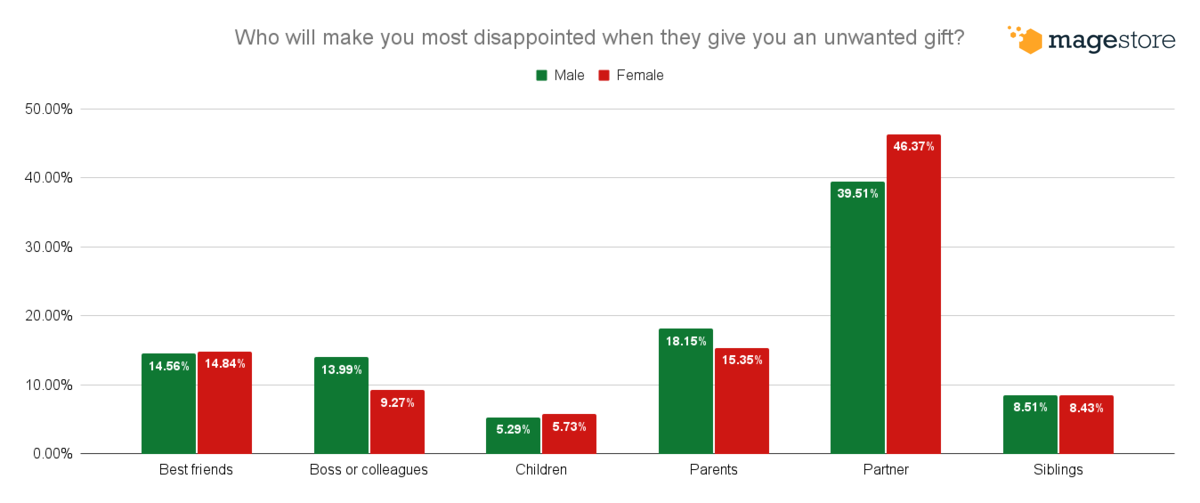
Most disappointing givers
Both genders consider their partners the worst giver of unwanted gifts, although a lot more women (46.37%) would be disappointed than men (39.51%). On the other hand, men are pickier about gifts from their workmates, with 13.99% citing their boss or colleagues as the worst givers compared to 9.27% of women.
Unwanted gifts by age
Least favorite gifts by generation
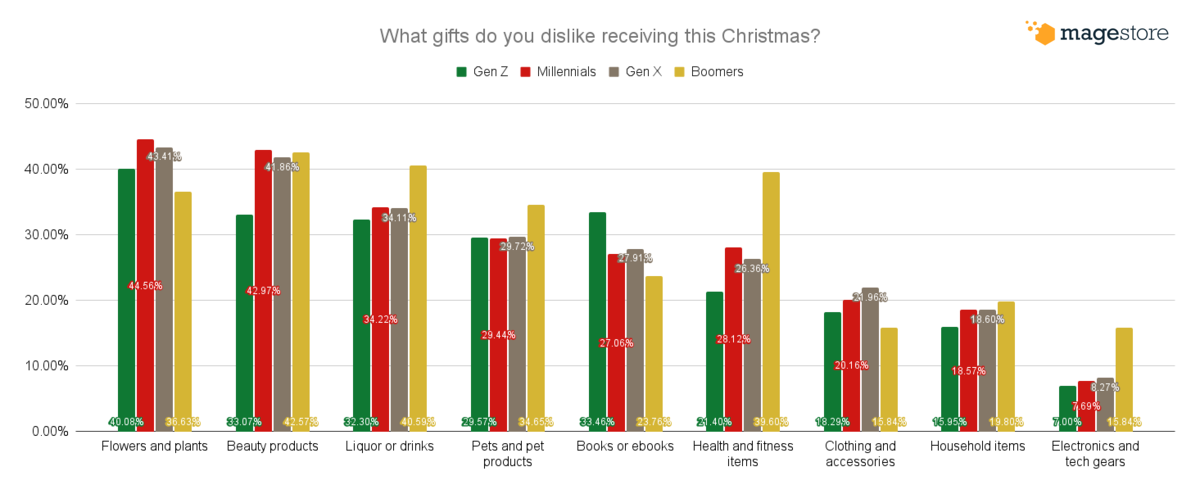
Gen Z’s least favorite gifts this Christmas include flowers and plants (40.08%), beauty products (33.07%), and books (33.46%). Gen X and Millennials share the same top 3 unwanted gifts: Flowers, beauty products, and drinks. The worst gifts for Boomers are beauty products (42.57%), liquor (40.59%), and health and fitness items (39.60%).
Types of gift | Gen Z | Millennials | Gen X | Boomers |
Flowers and plants | 40.08% | 44.56% | 43.41% | 36.63% |
Beauty products | 33.07% | 42.97% | 41.86% | 42.57% |
Liquor or drinks | 32.30% | 34.22% | 34.11% | 40.59% |
Pets and pet products | 29.57% | 29.44% | 29.72% | 34.65% |
Books or ebooks | 33.46% | 27.06% | 27.91% | 23.76% |
Health and fitness items | 21.40% | 28.12% | 26.36% | 39.60% |
Clothing and accessories | 18.29% | 20.16% | 21.96% | 15.84% |
Household items | 15.95% | 18.57% | 18.60% | 19.80% |
Electronics and tech gears | 7.00% | 7.69% | 8.27% | 15.84% |
Reasons
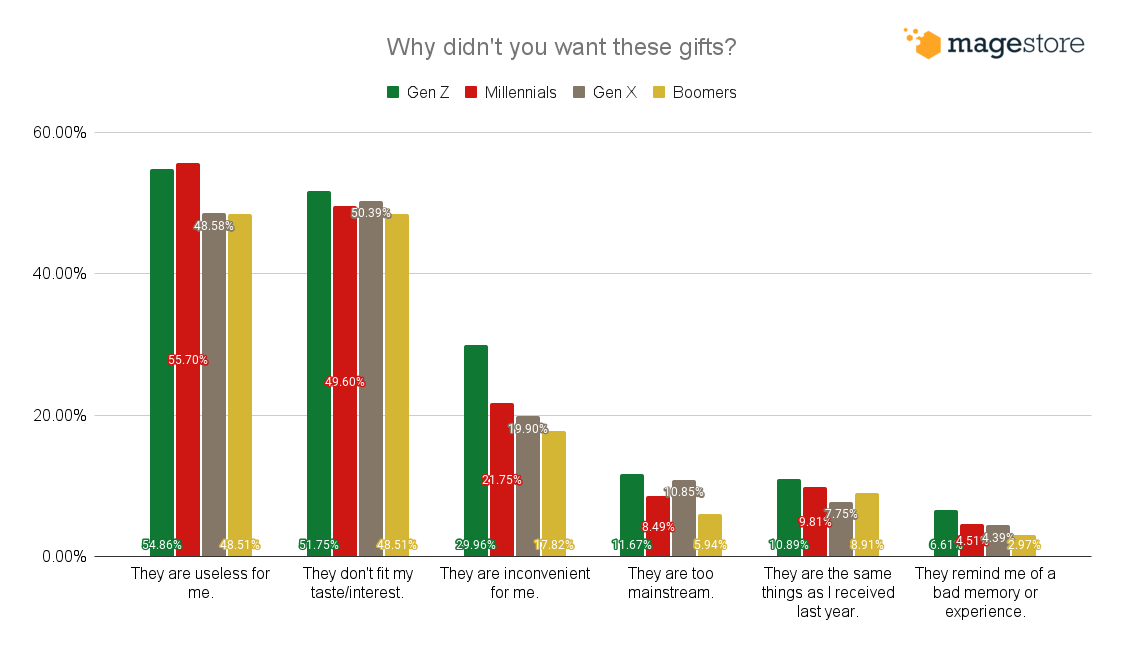
Practicality is a key point of consideration for Gen Z and Millennials, with 55% stating that they don’t want useless items as gifts. On the other hand, 50% of Gen X participants say they don’t want gifts that don’t fit their taste.
Reason | Gen Z | Millennials | Gen X | Boomers |
They are useless for me. | 54.86% | 55.70% | 48.58% | 48.51% |
They don't fit my taste. | 51.75% | 49.60% | 50.39% | 48.51% |
They are inconvenient for me. | 29.96% | 21.75% | 19.90% | 17.82% |
They are too mainstream. | 11.67% | 8.49% | 10.85% | 5.94% |
They are the same things as I received last year. | 10.89% | 9.81% | 7.75% | 8.91% |
They remind me of a bad memory or experience. | 6.61% | 4.51% | 4.39% | 2.97% |
What each generation does with unwanted gifts
Out of the 4 generations, Gen Z is the most likely to keep unwanted gifts (35.02%) while Boomers are the least likely (20.79%). Millennials are the most likely to throw away unwanted gifts (12.47%), and Gen X is the most likely to regift and donate them (57.88%).
Most disappointing giver
The partner is the most disappointing person to give people unwanted gifts across all generations, while each generation’s second most popular choice is usually their family. Parents are the most disappointing givers for nearly one-fourth of the Gen Z participants (24.51%) and one-fifth of Millennials (19.10%). For Gen X, 13.70% will be most disappointed by unwanted gifts from their boss or colleagues; and for Boomers, it would be their children (14.85%).
Holiday gifts and spending statistics

- Deloitte projects holiday sales will total $1.45 to $1.47 trillion during the November to January timeframe.
- According to ShipStation’s Holiday Shopping Trends Report, 3 in 5 consumers expect to cut back on non-food expenses; and holiday gift spending in the U.S. is expected to decline by $30.6 billion this year compared to the year before.
- PWC’s Holiday Outlook 2022 highlights that consumers will spend $1,430 on average, with $754 on gifts, $452 on travel, and $224 on entertainment. With 53% of Christmas spending going towards presents, avoiding the unwanted gifts will reduce billions of wasted dollars.
- GiftNow estimates the personal gifting market will reach a total of $462.8 billion in 2022. On average, shoppers plan to purchase 8 gifts and spend $580 this holiday season. That’s $65 per gift.
What retailers should do to prepare for uncertainty
- Define your supply chain strategy early to ensure you have enough inventory to sell, and how to handle stockouts and shipping delay
- Communicate your promotion and policy to customers early. Consumers are beginning their holiday shopping earlier, so you should reach out to them as soon as possible.
- Optimize your website and in-store processes to make it easy for shoppers to find products, check out, get support, and return
- Anticipate and plan responses to common holiday issues, such as substitutions for out-of-stock products or preprinted RMA forms
- Share helpful information to assist customers in their shopping experience, such as Christmas’ most wanted and unwanted gifts!
Methodology and limitations
To collect the data shown above, we surveyed 1,122 respondents located in the U.S. for their perspectives and decisions. Because the survey relies on self-reported information, issues such as selective memory and exaggeration can influence responses. Please also note that this survey’s results do not reflect our opinions.
Fair Use
If you know someone who could benefit from our findings, feel free to share this project with them. The graphics and content are available for noncommercial reuse. All we ask is that you link back to this page so that readers get all the necessary information and our contributors receive proper credit.
Read more related stats: