Chapter 05: Nail your omnichannel success with KPIs
When a retailer has invested their resources in an omnichannel strategy, it’s reasonable to pause and ask, “Is this really working?” But this simple question isn’t so easy to answer. By combining in-depth quantitative with qualitative metrics, you’ll be able to confidently identify which operations of your retail are leading, and which may need additional support to realize your omnichannel vision. Here’s how to measure omnichannel success with key performance indicators (KPIs).
This chapter includes 3 key points:
10 KPIs of omnichannel retail
To measure the health of your omnichannel strategy, you shouldn’t stick to measuring each part of the system separately. Instead, it’s more useful to track cross-functional metrics that address how different parts of your system come together to deliver an omnichannel experience for your customers. You can still measure individual components, but the key performance indicators should give you a holistic view of your operation and your customers. In previous chapters, we explored implementing an omnichannel system with two approaches: data and customer experience. In this chapter, we’ll divide the key metrics into 2 categories:
- Operation management: how to measure the inner workings of your business operation
- Customer experience: how customers interact with your business and how they feel about these interactions
Operation management KPIs
1. Cost of goods sold (COGS)
Cost of goods sold measures all expenses directly related to the production of your products and services such as material or labor. It excludes indirect expenses like distribution or sales force costs.

COGS is an important KPI on any retailer’s financial statements. It shows you the true cost of your products. For example, you can check if you’re spending too much on labor or materials. If you can’t change what you spend on materials and labor, you can adjust your selling price, prioritize some products over others to market, or make changes to other operating costs.
Retailers also need COGS to calculate gross margin, inventory turnover, and more. You should try to keep COGS low so your net profits will be higher.
2. Inventory turnover
Inventory turnover rate measures how often your business sell and replace your entire in-stock inventory during a given period (usually a year).

Here are some inventory turnover benchmarks in 2018 according to The Retail Owners Institute:
- Cosmetics, beauty supplies, and perfume: 3.0
- Furniture: 3.5
- Women’s apparel: 4.3
- Pet and pet supplies: 6.2
- Audio/video and consumer electronics: 6.9
Low turnover means either your products aren’t selling well or you’re overstocking. High turnover, vice versa, can be because of strong sales or insufficient inventory. In turn, you can adjust your marketing efforts or the purchasing of new inventory.
Slow-selling items will lead to higher holding costs, and prevent you from replacing them with newer and better-selling items. Tracking inventory turnover helps you understand the market demand for your products and the next steps to take.
Retailers should monitor this KPI closely and maintain a number suitable for their vertical.
3. Gross profit margin (gross margin)
Gross profit margin indicates how much of your revenue is actually turning into profit.

Why gross profit margin and not revenue or just gross profit? Unlike revenue, gross profit margin takes into expenses such as cost of production and sales. On the other hand, gross profit only shows an absolute profit value without the comparison to total revenue. Gross profit margin provides better contexts and highlights potential areas for improvement.
Take promotional campaigns as an example. They tend to increase purchase and average order value. However, you have to consider the costs going into production and marketing. Gross profit margin helps you see the actual profitability of these campaigns.
With gross profit margin, you can determine whether to focus on pricing, production, marketing, or development. The higher the margin, the greater the revenue left to cover operating costs and make a profit. Here are some gross margin benchmarks in 2018 according to The Retail Owners Institute:
- Cosmetics, beauty supplies, and perfume: 45.5%
- Furniture: 45%
- Women’s apparel: 46.5%
- Pet and pet supplies: 43.6%
- Audio/video and consumer electronics: 36.6%
4. Perfect order index (POI)
Perfect order index measures your fulfillment performance. The American Productivity & Quality Center (APQC) refers to it as the “act of flawlessly taking and fulfilling a customer order – including taking the order correctly, allocating inventory immediately, and delivering the product on time with an accurate invoice.”

There are 4 key components to this KPI:
- On-time
- Correct quantity
- Good condition and packaging
- Right documentation
Perfect order is a composite metric, summarizing four lower-level metrics. It demonstrates how different departments in your enterprise work together to deliver the right product to the right customer. At the same time, you can drill down and identify key friction points in your system to optimize performance.
Every omnichannel retail should aim to maximize this KPI. In addition to assigning clear accountability for the lower-level metrics to relevant departments, each department should be aware of their role in a larger picture to foster collaboration. After all, a chain is only as strong as its weakest link.
5. Rate of returns (ROR)
Rate of returns measures how often customers return the items they buy to you.

High returns rate means customers are not happy with their purchase and may not come back to your business. In addition, more returns mean you’re holding products that aren’t selling well, costing space and time that can be utilized for more popular items.
Combine returns rate with return reasons will help identify potential issues with product quality, sales and marketing promises, or customer service. For example, you can revise the quality control process for a certain product line. You can adjust your key message to reflect the benefits for your customers more accurately. You can also arrange further training sessions so your sales staff can consult your customers better.
While product returns are an inevitable part of retail, you should try to maintain this KPI as low as possible.
Customer experience KPIs
1. Conversion rate (CR)
Retail conversion rate measures how good you are at turning visitors into customers.

This applies to both your online and offline channels. Total number of visitors can be website traffic or retail store footfall.
Tracking CR is essential for retail success. This KPI helps you see if you’re making the most out of any visit to your store or website. If your sales channels attract plenty of traffic without a high and constant CR, you’re missing out of sales opportunities.
Even a 1% improvement in conversion rates can equate to millions of dollars dropping to the bottom line.
– Mike Santos, Retailers Counting On Conversion Analysis To Drive Store Metrics, Retail TouchPoints
Tracking channel traffic and conversion not only provides you with useful insights but also leads to transformational initiatives. Keeping track of CR will help you evaluate new marketing or operation initiatives. You can measure this KPI as a benchmark when you’re considering changes in store layout, staffing, inventory, or promotions.
2. Customer acquisition cost (CAC)
Customer acquisition cost measures the cost of attracting new customers and continue your growth.

CAC calculations are different for each business, depending on the variable and fixed costs you want to include. Total expenses may include the cost of:
- Advertising
- Sales
- Marketing
- Onboarding
- Customer service
CAC is another KPI to measure the profitability of customer acquisition strategies. It compares how much you’re spending to gain new customers against how many customers you actually earn. A low CAC means your investments are paying off.
You can use this KPI to compare between different channels, campaigns, and tactics. For example, comparing the CACs of your sales channels lets you know which ones are generating more customers at a lower cost. With this information, you can allocate your funds towards the more efficient channels.
Omnichannel retailers should strive to keep CAC as low as possible. Here are some strategies to minimize this KPI:
- Optimize CR, especially for online sales channels
- Shorten sales cycle so you’ll have to spend less to acquire customer
- Launch rewarding referral programs to get customers to recommend your brand
- Increase the perceived value of your products and services with extra add-on or special bundles
3. Customer lifetime value (CLV)
Customer lifetime value measures the projected revenue a customer might bring in over the entire time they do business with your retail.
Retailers might have different approaches to CLV calculation. Here’s one of the most common formulas:
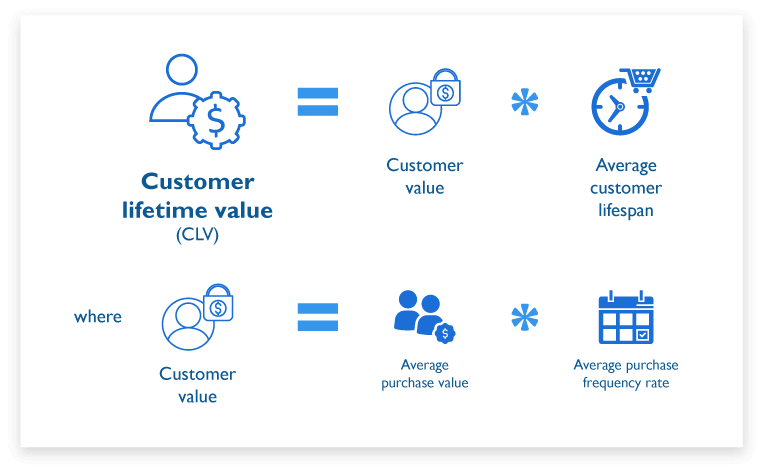
One of the previous KPIs, customer acquisition rate, evaluates your acquisition strategies in the short term. Customer lifetime value, by contrast, lets you see how sustainable and profitable these strategies actually are in the long run. CLV is one of the most important metrics that shows you the long-term revenue value of your average customer.
Identifying customers or segments with the highest CLVs will also determine your future strategy. Building good relationships with these customers are most likely to pay off in the future, and keep your business sustainable. Measuring both CLV and CAC will help you keep a balance between short- and long-term goals.
4. Customer retention rate (CRR)
Customer retention rate assesses your brand’s ability to keep current customers over the long term. It measures how often customers return to your business to make a purchase.

Customer retention rate indicated customer satisfaction with your business. If your customers are happy with their shopping experience, they are more likely to return. Increasing CRR is one of the ways to increase customer lifetime value.
Higher CRR usually equals higher profits for many reasons. Compared to new customers, returning ones:
- Are more likely to convert
- Spend more on each purchase
- Spend more at key times and busy season
- Refer more people to your brand
Returning customers mean higher sales, lower costs, and more referrals. Measuring CRR and adjusting your strategies accordingly is a good way to keep this number high and make sure your business is running well.
To increase customer retention rate, retailers should:
- Run a loyalty program across all sales channels
- Collect customer feedback to improve your operations
- Monitor and review your customer service program
- Improve current communication channels and experiment with new ones
5. Net promoter score (NPS)
Net promoter score measures customer loyalty based on behaviors.
Business can calculate NPS by asking their customers a survey question: “How likely is it that you would recommend our brand to a friend or colleague?”
Based on the responses on a scale of 0-10, retailers can categorize their customers into three groups:
- Promoters: Regular and loyal customers with a score of 9-10
- Passives: Satisfied but not particularly enthusiastic customers with a score of 7-8
- Detractors: Unhappy customers with a score of 0-6

NPS gives your team a straightforward and complete view of customer satisfaction. There’s no need to wait for complex revenue figures or costly survey results. It shows how customers feel about your business as a whole, from your product, website, social presence, frontline staff, and everything else. The higher the NPS, the better.
In addition, NPS is an essential KPI to identify opportunities and threats to your retail. Promoters can increase your revenue with repeat purchase and become advocates for your brand. On the other hand, detractors might discourage people from giving your business a go and post negative reviews on social media and other communication channels.
You can also follow up on the standard question with one or two follow-ups. These questions typically ask customers for the reasons behind their scores. This gives you insights into what you’re doing well and possible areas to review and improve.
In summary, here are the 10 omnichannel KPIs retailers should track:
| Operation management | Customer experience |
|---|---|
| 01. Cost of goods sold 02. Inventory turnover 03. Gross profit margin 04. Perfect order index 05. Rate of returns |
01. Conversion rate 02. Customer acquisition cost 03. Customer lifetime value 04. Customer retention rate 05. Net promoter score |
| Operation management |
| Cost of goods sold Inventory turnover Gross profit margin Perfect order index Rate of returns |
| Customer experience |
| Conversion rate Customer acquisition cost Customer lifetime value Customer retention rate Net promoter score |
Design your KPIs
A quick Google search for “retail KPI” will leave you with 13 million results. You can easily make a long list of KPIs from these results, but they might not work for your business.
”KPI is a model of reality, not the reality.
Tim Cook: The Complete Interview – Sam Grobart
KPIs help identify certain things about your business performance. However, looking at a list of KPIs alone doesn’t automatically lead to result or improvement. In order to achieve operational and customer experience excellence, you need to select the right metrics and understand how they might point you in the right direction.
Given your limited time and resources, what would you track and how would you find them?It’s important to work out how to calculate the contribution of various investments towards your business goals. By constantly monitoring and adjusting attribution results, your team can identify what strategies and tactics are generating the best results.To create your attribution strategy, you can follow a customer-centric approach and map out customer experience. This means identifying how customers interact with your brand across all channels. In addition, pay attention to internal processes that make the experience flow smoothly. You should also capture all external processes such as partnership or outsourcing. A holistic view of the customer journey can reveal the weakest links and create a good case for change.Building the customer experience map will require insights from all departments of your business. They may be:
- Sales and customer service staff that interact with your customers on a daily basis
- Managers and employees who process your orders, manage products, handle purchasing and procurement
- Lead developers of your retail system
One of the best ways to gather everyone’s input is to organize a group session with whiteboard and sticky notes. This means every participant gets a chance to contribute to the customer journey map. They can share opinions and discuss where the problems might and might not be.

Having a variety of perspectives means there will be disagreements on what the issues are and how to fix them. As a result, the meeting should be led by someone that’s respected by all participants and has experience in facilitation. This person needs to ensure that every opinion is given the same weight and steer the conversation towards something productive.
It’s essential to track the effectiveness of both your online and offline channels. Omnichannel experiences might range from click and collect to buy online, return in-store. Combining data from your website and brick-and-mortar store is the only way to evaluate the effectiveness of these features.
Customers in the omnichannel age constantly utilize their devices and surrounding technology to research and buy, at home or inside your store. As a result, retailers need to consider technological investments that complement the in-store experience. This means researching and evaluating options such as kiosks, in-store WiFi, beacons, geofencing, and more.
To accurately measure the success of omnichannel experience, retailers must capture and analyze the performance of all touchpoints in a holistic manner.

In an omnichannel journey, customers are interacting with your brand across several touchpoints. For example, they might come across your brand after a Google search, Instagram recommendation, or promotional email. Then they may come to your brick-and-mortar store to try your product and make a purchase.
Your customers will form an opinion of your brand and perceived value based on every single one of these interactions. As a result, retailers should measure and monitor customer service and satisfaction on all touchpoints, from live chat to social media.
A complete picture of your customers is the key component for omnichannel retail success. As a result, retailers should invest in tools to organize and unite customer data such as customer relationship management or customer business software. This will help you identify and monitor customer interaction across channels.
Once you’ve decided on your KPIs, you should document them to keep everyone on the same page. To keep track of your KPIs, you should list out:
- Definition
- Purpose
- Calculation
- Data collection
- Reporting
Here’s a template to help you design your KPIs.

Collect data for your KPIs
To track KPIs, retailers need to bring together data from various sources regularly. Customers are constantly changing and what they loved two years ago may not be what they want today. In this way, merchants have the latest data on their customers and performance on hand to adapt and optimize their business.

You can start by accumulating customer data every time they interact with your company. Here are some of the most common touchpoints you should track in the customer journey:
Your POS system is probably the most significant data point in your brick-and-mortar store. In addition to capturing sales, it can help you record customer information, process orders, run loyalty programs, and more. Some POS systems are even equipped with reports that make it easier for you to analyze customer behaviors. Thanks to real-time synchronization between POS and Magento, a Magento-native POS can:
- Save time and effort in management
- Ensure information consistency across all channels
- Bring a better experience to both retailers and customers

Some Magento POS can help you achieve your omnichannel system at a reasonable price. Moreover, there are built-in reports that show the performance of the overall business as well as that of each store or even cashier. With all data in one place, it’s easier for you to monitor your KPIs, track down issues, and make better decisions.
- Transactional data such as product, payment, shipping method. This helps you determine customer demand. You can also calculate KPIs related to inventory performance and cost.
- Customer feedback: Your website should have some forms of survey that customers can fill in quickly when browsing. This can be a list of questions (one at a time) about how easy it is to navigate your website or how customers feel after a live chat session. This helps you gather feedback without much expense and effort. With this, you can improve your current services or develop new ones that match your customer’s expectations.
Mobile
”Mobile technology enables [retailers] to optimize inventory planning and management and point of sale, personalize the customer experience, as well as boost employee productivity and motivation.
GlobeNewswire.com
More and more customers are using mobile devices to research and purchase. According to Adobe’s 2018 Holiday Predictions, mobile accounted for 51.4% of site visits and 34% of revenue. With mobile app, you can collect information on location, browsing and shopping habits, customer feedback, and more.
Customers in the digital age make decisions heavily based on social recommendations and referrals. Social media makes it easier for brands to sell and interact with customers. It’s also a good data source, collecting information from customers through direct comments or mentions. You can also conduct quick polls to receive immediate feedback, and use their analytics tools to gather the data you need on visitor behavior.
If you’re looking for new ways to get a better understanding of your customers, in-store WiFi is a valuable resource. When users sign in to a network, they may be asked to provide personal information such as name, email, phone numbers, age, etc. You can collect and analyze this data in your system to better target and serve your shop’s visitors.

You can integrate existing loyalty databases with your WiFi system, allowing users to login with their loyalty credentials.
Arguably the biggest benefit of beacons is the ability to simultaneously connect personal data with location-based data. This data can be used to leverage customer brand affinities and demographics to pull in premium sponsors and provide a better customer experience using customer-preferred brands. It helps build an overall trusted, high-quality customer experience that increases customer lifetime value and improves business processes.Retailers can use this data, for example, to make improvements to products, staff allocation in various departments and services, and so on. Here are a few metrics that can be captured by integrating beacons with your system:
- Footfall, visits online, visits through apps
- Recency and frequency of visits, behavior and transactions
- Merchandising and marketing effectiveness
- Loyalty program utilization
- Service quality, queue and abandonment
Call center provides direct communication with your customers and gives you plenty of feedback about your product and service. Data from the call center are valuable to the whole business and can be utilized to drive operational change.

You can tap into call center data and use sentiment analysis to discover how customers view the most recent ad campaigns, marketing messages, or product line. You can hear straight from customers what works, what doesn’t, what they like, and what they don’t like.
The access to near real-time market research at an exceptionally low cost allows retailers to quickly adapt to their target audience by adjusting existing campaigns. It also informs future efforts so they reach the right audience through the right channels at the right time.
The voice of the customer is a key indicator of navigating change. The information and data that can be pulled from customer interactions is invaluable and should be leveraging this data to help create a cohesive experience across all interaction points. With this concept, retailers can transform the call center from a cost center to a business intelligence hub that drives the next generation of customer-centric retail.
Conclusion
Designing and tracking KPIs is an essential requirement to ensure omnichannel success. These KPIs should help retailers assess the customer experience you’re delivering, and how well your operation is performing. While there are KPIs that every omnichannel retail should track, you should consider your omnichannel workflows to make sure you design the KPIs that best fit your business.
Continue Reading
Previous Chapter
Omnichannel on Magento
Next Chapter
Succeed in Magento Omnichannel Retail