POS Report Guide Chapter 3
5 important inventory reports your business can’t ignore
As an inventory manager, a small error in tracking inventory could cause major trouble for you and the business you’re working for. To successfully handle the situation, it’s essential to manage your inventory as accurately and optimally as possible. That’s why essential inventory reporting metrics can be your lifesaver.
After reading this chapter, you can start using the 5 most important inventory reports to track progress across inventory management stages.
This chapter includes 3 key points:
Inventory manager role and duties
An inventory manager controls the inventory of a single retail store or all stores in mid to large-sized companies. Depending on the size of the business, inventory management duties may involve:

Evaluating suppliers
It’s an important responsibility of inventory managers to find suppliers who will provide the business with the necessary goods to run daily selling activities and generate profits. Besides always maintaining a good working relationship with suppliers, an inventory manager also needs to be aware of other available suppliers in the area who are willing to offer quality products or materials at a better price.
Purchasing new inventory
Some organizations may have a separate purchasing department that negotiates and signs contracts with suppliers. But in smaller retails, inventory managers might take the responsibility of managing the ongoing relationship with suppliers. A good inventory manager must know how much inventory is left, what is running low, and figure out the correct steps to maintain the inventory balance.
Preparing inventory insights
Another responsibility of an inventory manager is managing inventory data. Like other management roles, you must record any inventory characteristics such as quality, quantity, type, and style of all ranges of products to know what is and isn’t available. These data also help your company avoid shrinkage due to loss or theft because the inventory manager always has a running tally. The data prepared by the inventory manager can also be valuable information for marketing managers when determining strategies to effectively move inventory.
Tracking inventory
This is the most important and obvious responsibility to acknowledge, considering how the knowledge of your inventory flow impacts all three of the duties mentioned above. In general, the inventory manager is responsible for ensuring the retail business has the right amount of stock to meet customer needs and also to avoid overstocking items.
To make inventory control much easier, in this chapter, we will focus on a centralized POS report system where inventory managers can see inventory visibility clearly across all channels of the business.
Why do they need to have a POS report?
Like we mentioned earlier in Chapter 1, POS reporting means reports generated with the data from a point of sale system. POS reports are crucial for mid to large-sized businesses owning a chain of stores. Because it requires their report system to connect all the in-store data together with other sales channels and show the data correctly at the point of sale in real time.
So, to track the right inventory records, all the POS data will be inputs for inventory managers to watch closely and take accurate actions.
Inventory managers need to run POS reports from their warehouse management system to check warehouse performance, find areas to improve efficiency, and speed up delivery. This part is critical for diagnosing the health of your inventory and warehouse management processes.

Explore solution: Track & manage items in real time for better inventory visibility
Now you know why an inventory manager needs to use POS reports to track inventory. But how do you identify which type of POS reports are truly helpful for inventory managers? Keep on reading to see the top 5 POS reports that inventory manager roles can’t live without.
Top 5 must-have inventory report for managers
To run inventory control smoothly, the inventory manager needs to keep track of crucial reports that give you not just the updates in numbers but the meaning behind them. Those reports will give you a more complete picture of the inventory status and help you decide the next steps to keep the business running smoothly.
The top 5 POS reports for inventory managers are:
- Inventory on hand report
- Inventory aging report
- Low inventory report
- Turnover inventory report
- Inventory discrepancy report
We’ll go into details about what each report is, why we use it, and how to analyze the numbers.
Inventory on hand reports
If your retail constantly runs out of stock, your customers will shop at your competitors instead. To make sure that the products in your store are always ready to sell, you should know what items are running out of stock.
In the meantime, if there are some items in the inventory for too long, it means you fail to sell them in a timely manner.
This inventory on hand report will show you a detailed overview of your inventory with a list of all the products and variants that you have in stock by each warehouse/store.

Important metrics
Here are the key metrics on an inventory dashboard:
Product Name
Name of the product.
Supplier
Name of the supplier of the product.
Location
The location where the inventory on hand is stored. If you store the same product at multiple locations, there might be a separate entry for each location.
Cost
The cost to your business for one unit of the product.
Starting Inventory
The number of units of a product on hand at the beginning of the selected date range. For example, if you are looking at the report for the month of August, this column displays the number of units on hand on August 1st.
Received
The number of units of the product added to your inventory during the selected date range.
Usage
The number of units of the product sold during the selected date range.
On Hand
The current number of units of the product held in inventory.
Variance
The number of units of a product not accounted for. This number is calculated by taking into account the numbers listed in the Starting Inventory, Received, Usage, and On Hand columns.
Variance Cost
The total cost of the variance. This number is calculated using the cost of the product, not the retail price.
On Hand Value
The total cost to your business for the units of a product held in inventory at the location. This number is calculated using the cost of the product.
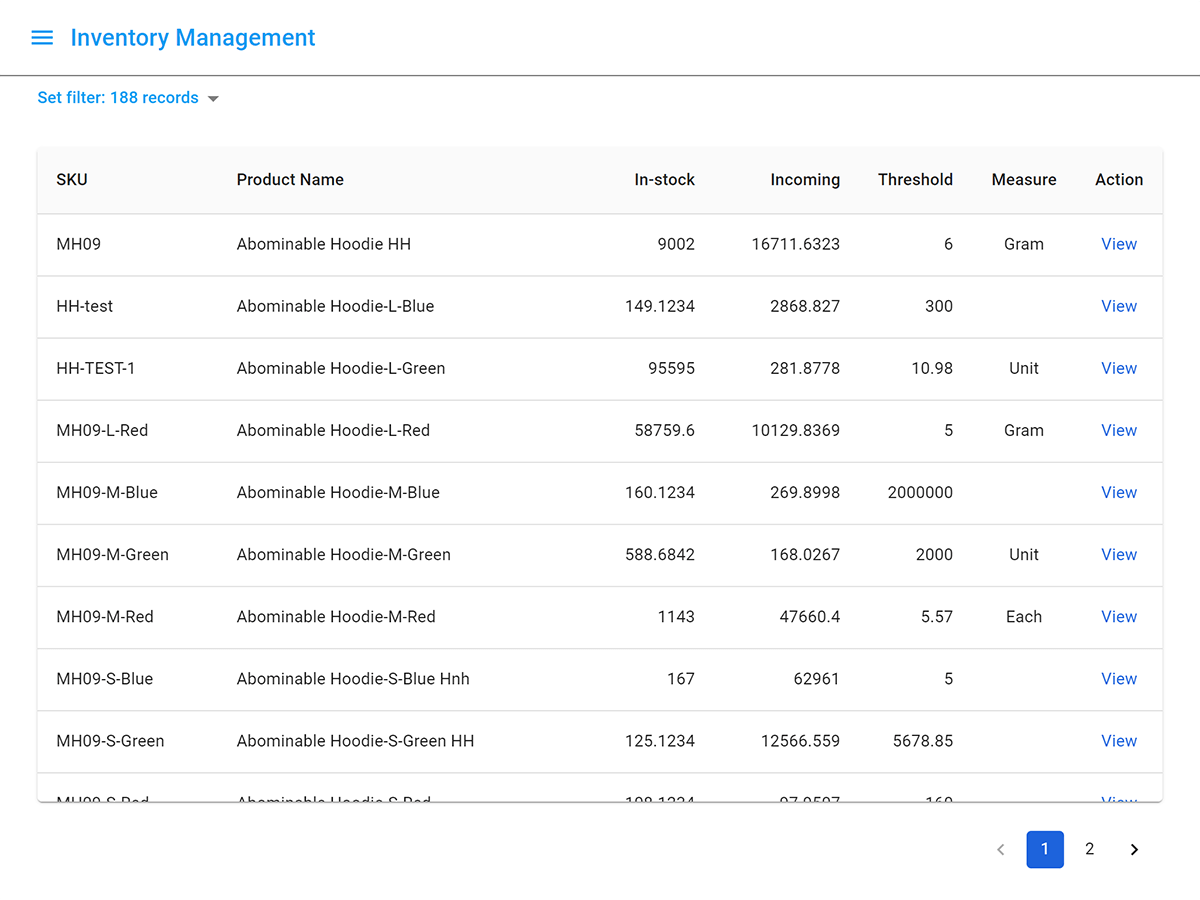
An example of an inventory on hand report in Magestore Retail Management PWA
Other metrics
Bar Code
The barcode associated with the product.
Retail Price
The selling price of one unit of the product.
Reorder Level
The number of units of the product you must have on hand to prompt contacting the supplier to order more units.
Report example
You have a product with the starting inventory of 25. According to the number listed under Usage, you sold 5 units, but you currently have 19 units on hand. So the variance for this product would be 1. When you see variance numbers like this, you should double check and investigate why those products have unaccounted units.
Inventory aging report
This report gives you a rundown of the number of days you’ve been holding stock and the quantity.
It’s important to keep tabs on how much inventory is sitting on the shelf and for how long.
The inventory aging report provides business with insights such as:
- Slow-moving items
- Non-moving items
- The length of time your products sit in inventory
- The cost of maintaining inventory for long periods of time
This will give you a better understanding of what products customers are buying versus products they are not purchasing so that you don’t invest a lot of money into products that will never sell.

Metrics
The report shows the average aging metric by days. Depending on your business industry, you might divide it into different periods of time to control. This number is easy to see and understand in the report, but how to calculate it?
To calculate the average age of inventory, you need to take the average cost of inventory and divide it by the cost of goods sold for the period. Then, you take that result and multiply it by 365 to get the average age of inventory.
Other measures
- Cost of inventory
- Average cost of inventory
- Cost of goods sold
- Time to pay for suppliers
Inventory aging report example
After reviewing the inventory aging report, you see the item Jacket-white-L has been holding in stock for more than 15 days. Then you need to further investigate to see why these items have not sold. It could be that you are ordering too much inventory and that is why you have excess on the shelf. If so, reduce your purchase order for Jacket-white-L and communicate to the sales and marketing team to increase customer demand for this item.
Low inventory reports
The low stock report lists all products which are low on inventory based on minimum stock levels (or re-order thresholds) defined against each product. If the current on-hand inventory is above the product minimum level or the product has no minimum stock level set, it will not be displayed on the low stock report.
Looking at low stock reports on a regular basis enables you to spot patterns around which products are constantly running low. If a particular product is always showing on this report, for instance, that could indicate the need to increase your order quantities.
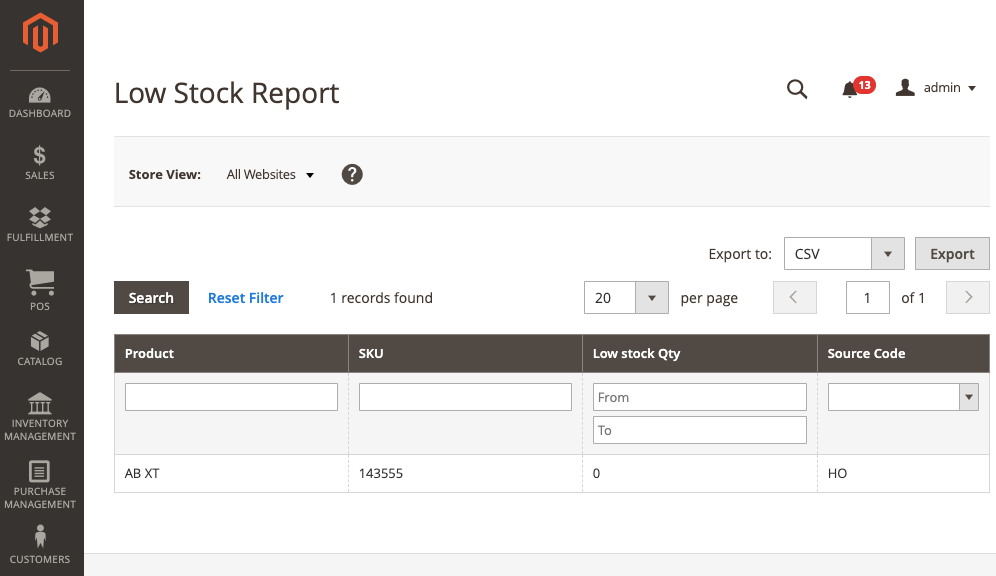
An example of a low stock report from Magestore
Metrics
On hand quantity
The total you have physically available (including Qty Reserved), minus any items that have already been reserved for a sales order.
Minimum stock
The minimum quantity you set on each item.
Other measures
- Manufacturer/Supplier
- Incoming quantity
- Unit of measure
Report sample
Look at the report, you can see the On hand qty of Apple Wireless Keyboard is 5 but the minimum stock is 10. It means that you should re-order 5 items from suppliers or transfer more from another warehouse.
Turnover inventory report
Most often, turnover is used to understand how quickly a company collects cash from accounts receivable or how fast the company sells its inventory. You can use the inventory turnover report to evaluate year-to-date inventory turnover. Analyzing high and low turnover items can help determine which items are overstocked (low turnover rate) and understocked (high turnover rate).
This report enables you to adjust sales, pricing, and reordering strategies. Turnover can be shown by item or warehouse/store.

Metrics
Cost of goods sold
Cost of goods sold is an expense incurred from directly creating a product, including the raw materials and labor costs applied to it.
Average inventory
The average cost of a set of goods during two or more specified time periods. It takes into account the beginning inventory balance at the start of the fiscal year plus the ending inventory balance of the same year.
Inventory Turnover Ratio = (Cost of Goods Sold)/(Average Inventory)

Other measures
- Units of measure
- Opening and closing stock
- Goods issued during the reporting period
- Min stock levels
- Lead times
- Next reorder point
- Last receipt date
Report sample
If the inventory turnover for a particular item is too high, it could be an indication that you need to order more of it.
Inventory turnover is low when the demand is low or when it becomes deadstock inventory. If it’s because of fewer sales, the inventory manager should talk with the sales manager about sales policy or promotion. If it’s because of outdated or obsolete items, you can return or remove them to save storage cost.
Inventory discrepancy report
The differences between inventory records and actual stock counts are a real problem for businesses, potentially costing the bottom-line in lost sales, build-up of surplus stock, and customer dissatisfaction. Discrepancies revealed by a company’s stock-taking procedure also have a direct effect on how a company values itself and its assets.
This report shows discrepancies between inventory records and the number of stocks you actually have on hand. For inventory managers, you need to analyze this report regularly to help avoid inventory issues.

Metrics
Date
The date an adjustment was made.
Theoretical quantity
What you should have on hand based on the POS sales report and actual inventory.
Actual quantity
What you have on hand based on the taking of inventory.
Difference
The adjustment that was made; whether it was an addition or subtraction.
Report sample
With this report, you can identify inconsistencies by product and location. Reasons can vary from shrinkage to theft, misplaced stock, and more. If it’s because of human error, one of the easiest ways to minimize future errors is to provide adequate staff training. You could also simplify all inventory processes and clarify stock locations, making sure products are marked clearly, are easy to access and the locations kept well organized and properly maintained.
Conclusion
Besides all the key 5 reports above, there are other important reports that are worth looking at. On the other hand, inventory managers also need to keep their eyes on sales revenue and collaborate with the marketing team to know if those products are worth importing next time.
Inventory report has a close relationship with the data from POS where all the sales activities happen and how it affects the inventory metrics. By taking a look at some of the important reports from POS, inventory managers can see how the inventory moves up and down, then implement proper actions towards each of the issues.
Depending on the retailer’s industry, size, and POS system, there will be differences in the level of details of these inventory manager reports. But if you’re a Magento merchant looking for customized retail reports, you can talk to us and get a free business analysis on a POS reporting solution.