POS Report Guide Chapter 4
Top 5 marketing reports to increase revenue & customer experience
Marketing managers play a key role in retail sales, customer relationships, and brand visibility. To track key marketing KPIs, managers need marketing reports that provide a complete picture of the customer and how they interact with your retail business. With them, you can make better decisions to focus your marketing efforts to get the most value from the customer with less cost.
This chapter discusses the marketing manager role and the 5 most important marketing reports for your retail business.
This chapter includes 3 key points:
Responsibilities of marketing managers
Marketing managers are responsible for the positioning and promotion of the products that a retailer sells. They analyze customer demand to develop promotional strategies to meet sales goals. They manage advertising and promotional budgets so that the company meets its financial targets.
The duties of marketing managers involve 3 aspects:
- Customer: Create plans to attract new customers and serve existing customers better
- Promotion: Set up promotion calendar and report on promotional campaigns to ensure the retail business sees a good return on investment
- Branding: Oversee marketing campaigns to increase brand awareness and monitor brand perception
Why marketing managers need POS reports
Marketing managers need in-store retail data to understand how customers shop in your offline channels. By combining information in your point of sale system with other sales channels, you have the insights to improve your marketing activities.

POS reports help you answer the following questions:
- Who are my customers? What are their shopping habits?
- What kinds of content and campaigns should I run to target these customers?
- What products and services are resonating with my customers?
- How are my marketing campaigns performing and how can I improve them?
The success of a business depends on whether you can deliver the right product to the right customer at the right time and price. Retail marketing managers need to analyze POS reports so they can create strategies to increase sales and customer experience while keeping a good margin.
Top 5 POS marketing reports for retail marketing managers
To make sure that your customers have a positive experience with your brand across all touchpoints, managers need to monitor marketing results from all sources. You need good data that give digestible insights and provide clear next steps for your marketing team.
Here are the 5 most important marketing reports to track:
- Marketing dashboard
- Discount report
- Customer report
- Customer loyalty report
- Product category report
For each report, we’ll look at the key metrics and an example of how to interpret the numbers.
Marketing dashboard
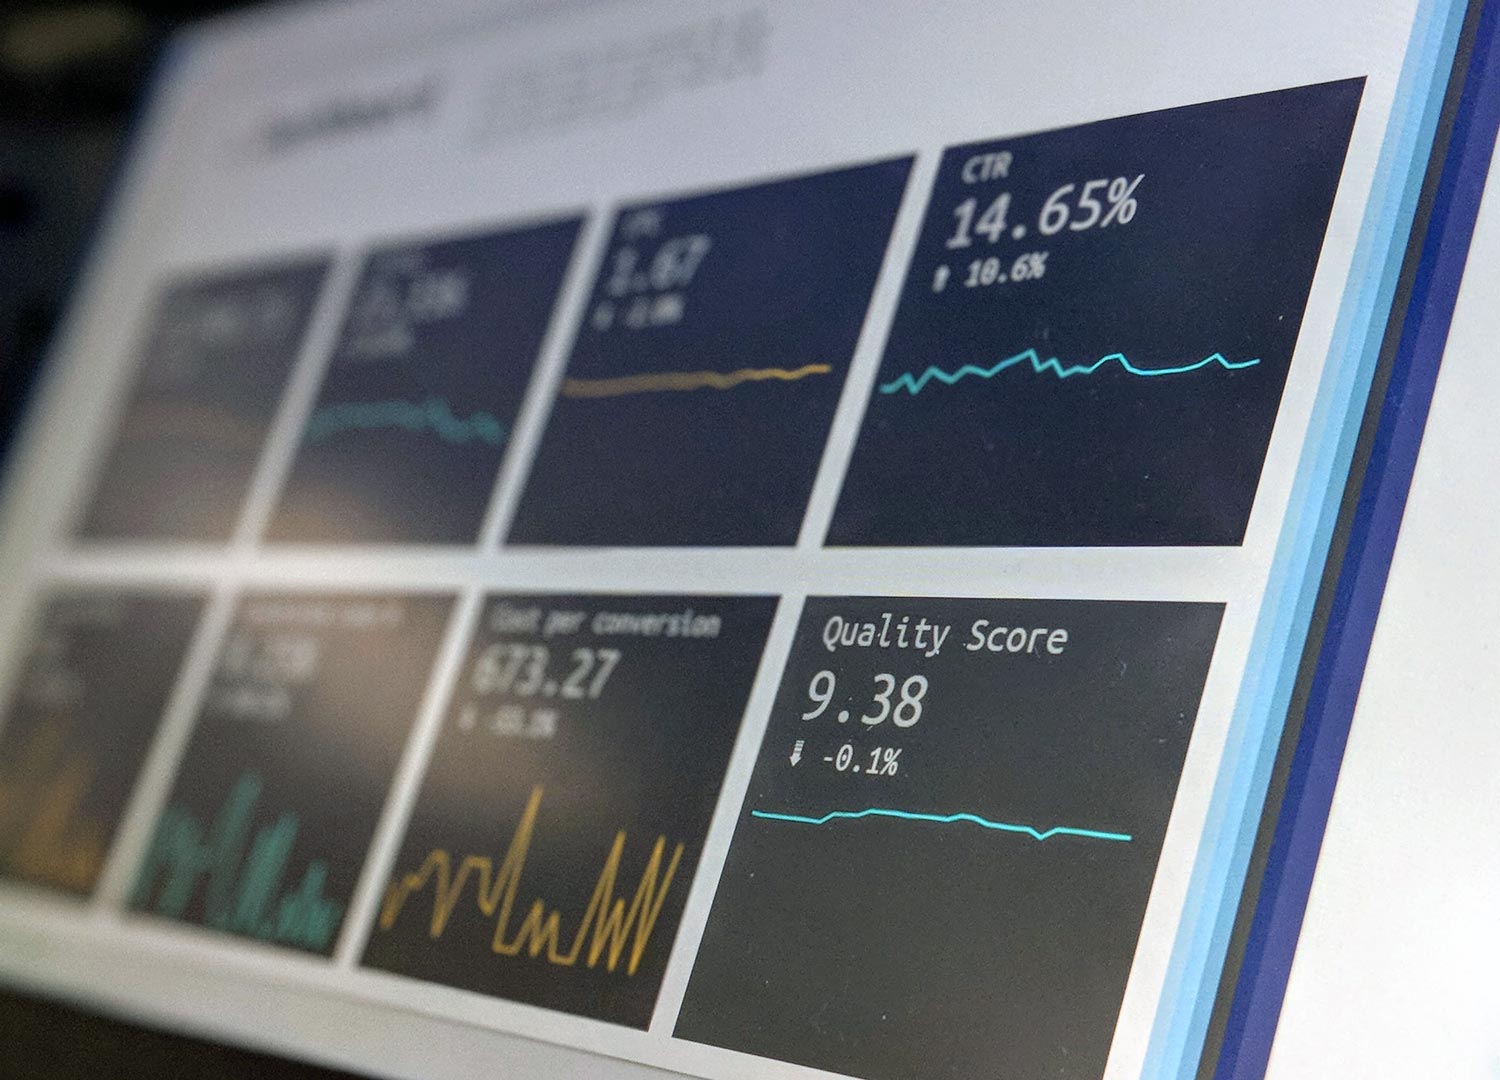
A marketing dashboard visualizes both sales and marketing data to see the business performance of all channels, including physical stores. Marketing managers can use the statistics to identify issues or new trends to quickly come up with ideas to increase brand awareness and revenue with better promotions.
The marketing dashboard reports should help managers filter by time, staff, store, customer, category, and more.
Metric
Footfall
The number of people entering your store. To count the number of visitors, some retailers use manual clickers while others use more advanced technology such as door counting sensors or WiFi counters.
Footfall helps marketing managers gauge how good your marketing campaigns are at bringing customers to your store. With it, you can identify the peak hour of your store and forecast demands for your products. You’ll also need footfall to calculate conversion rate and average transaction value.
Conversion rate
The percentage of people who visit your store versus the people who leave with a purchase. The conversion rate is calculated by dividing the footfall by transactions.
Conversion rate is one of the most important marketing metrics to measure how well your stores are performing. If footfall represents the number of sales opportunities, conversion rate measures how good your business is at utilizing these opportunities. The changes in conversion rate are one of the ways to measure the effectiveness of new marketing campaigns or merchandising tactics.

Gross sales
Total sales from products and services, calculated by multiplying the number of products sold by sales price.
Marketing and sales managers need to work together on the gross sales to determine how much marketing efforts are converting into sales, and identify new pricing and product strategies to increase revenue.
Net sales
Gross sales minus total returns, allowances, and discounts.
Marketing managers need to track net sales to ensure that your business isn’t having too much discount or too many returns.
Discount and markdown
A temporary or permanent decrease in a product’s price to boost sales.
The discount percentage equals the discount amount divided by original price. On the other hand, the markdown percentage equals the discount amount divided by the lower sales price.
Discounts and markdowns affect the profit margin of your business. Marketing managers need to keep track of discounts and markdowns to make sure the business maintains its bottom line while clearing out unwanted inventory.

Other metrics
The marketing dashboard can also include cost of goods sold, returns, value or returned goods, and return on investment.
Let’s look at an example to see how managers can use marketing dashboards to analyze and make business decisions.
Marketing analysis example
Checking the marketing dashboard, you see that the conversion rate for one store decreased. Since conversion rate equals traffic divided by transactions, you can check these metrics to see what happened.
In this situation, traffic went up but transactions remained the same. This means while you’re attracting more customers to your store, they haven’t bought your products.
To increase transaction numbers, you will need to improve the customer experience inside your store. For example, you can adjust merchandise displays inside the store to showcase best selling products more prominently or include more bundle deals. Besides, you can discuss the traffic trends with sales managers to have more staff during peak hours so they can help the customers more effectively.
Discount report

Discount is a must-have marketing report to evaluate the effectiveness of discount campaigns and markdown calculations. Marketing managers use this report to build the retailer’s promotional calendar to boost sales, maintain margin, and increase loyalty.
Discount reports should give you the option to filter by time, program, customer, product, and store.
Metrics
Types of discount
Marketing managers can choose to run many types of retail promotions including:
- Percentage, such as 10% off certain categories or all products
- Dollar amount, usually applied for certain items or via coupons
- Buy one get one (BOGO) free or discounted
- Free shipping, usually for orders over a certain amount
Managers keep track of different discount types to see which method is most effective in generating revenue without a negative impact on your bottom line.
Times applied
How often the discounts are applied throughout a time range. Usually measured by the number of transactions with the applied discounts.

Discounted amount
The total dollar amount of discounts. Depending on the discount types, it could be the discount percentage or loyalty points converted into dollar amount, the selling price of the giveaway products, or the normal shipping fee.
Other metrics
Discount marketing reports can also include gross sales, basket size, returns, margin, and staff.
Marketing analysis example
Imagine you want to run a campaign to get rid of some slow-moving inventory. You can pair the items with other relevant products to create different package deals, and measure the results to see which bundle brings in the highest sales and margin.
Customer report

Understanding customer demand is the key to the success of a retail business. Managers need this marketing report to get insights into who is purchasing from you and find solutions to delight your customers.
Your understanding of customers in your physical stores depends a lot on what information you can collect with your point of sale system. If the POS is integrated into the rest of your system, it should give you a complete understanding of each customer and their experience with your business.
Customer marketing reports should enable you to filter by time, location, and customer attributes (age, gender, size, location, etc.). Based on the data, you can segment customers and tailor your offerings to increase customer experience and loyalty.
Metrics
Transactions
The total number of orders of the customer across all channels.
Quantity sold
Total number of items the customer buys from your business.
Sales amount
Total purchase in dollar amount from the customer.

Average basket size
The average number of items the customer buys in a single purchase. Equals quantity sold divided by transactions.
Average basket value
The average amount the customer spends per purchase. Calculated by dividing the total sales amount by transactions.
Other metrics
This marketing report can include discount, return, margin, and if you run some loyalty programs, current points balance, and membership tier.
Customer analysis example
Due to COVID-19, your business probably experienced a drop in sales, basket size, and basket value across offline stores.
To maintain revenue and save costs, marketing managers can suggest more focus on online activities. This includes expanding home delivery options and offering more promotions on your website. You can also talk with sales managers about contactless operations in-store to make sure both your customers and the employees are safe during the pandemic.
Customer loyalty report

To grow your customer base, marketing managers can either target new customers or encourage existing customers to come back. The ability to keep your customers engaged with your brand is essential to a retailer’s long term success and requires less investment.
The customer loyalty report shows how many customers you gain, lose, and keep during a period. Based on this report, marketing managers can decide how much effort to put into customer acquisition and retention, and the strategies to maintain brand loyalty.
Metrics
Customers
The total number of customers who purchased items during the period.
Purchase frequency
How often a customer buys from you. To calculate the frequency, divide the number of transactions by the number of customers (usually in one year).
Time between purchases
How many days it takes for a customer to make a repeat purchase. Equals total days divided by purchase frequency. Since this number is often calculated for one year, the total days is usually 365.
Marketing managers can use this metric to set the time for email marketing or determine when a customer is inactive/lost.

New customers
The number of new customers. This is usually calculated by the number of new accounts created in your system during the time range.
Returning customers
Number of returning customers. This usually means the customer has an existing account in your system.
Lost customers
Number of customers who didn’t return to your business or close their accounts. To determine whether a customer is lost, you can use the time between purchases as benchmark.
Customer retention rate
The percentage of customers that your retail has retained over a period.
To calculate this number, subtract the new and lost customers from the total number of customers at the beginning of the period. Divide this number by the total number of customers at the start of the period, then multiply it by 100.
For example, if at the start you had 200 customers, gained 20 during the period, and lost 10, the retention rate would be: ((200-20-10)/200) x 100 = 85%.

Customer churn rate
The percentage of customers you lost during a time range. The most simple way to calculate churn rate is to divide the number of lost customers by the number of customers at the beginning of the period.
Other metrics
This marketing report can include sales amount, average order value, and customer lifetime value.
Customer analysis example
Imagine a situation where you see a decrease in customer retention rate in the last quarter. When investigating the data, you realize that the number of lost customers was higher than average during the last month of the quarter. This could be because one of your competitors was running a discount during that time.
If the competitor’s promotion program is still ongoing, you can run an email marketing campaign to re-engage with your customers, especially the ones who are near the end of their period between purchases. You can also create some special offers for customers such as free shipping or using underperforming items as freebies for certain purchases.
Product category report
Explore solution: Track & manage items in real time for better inventory visibility
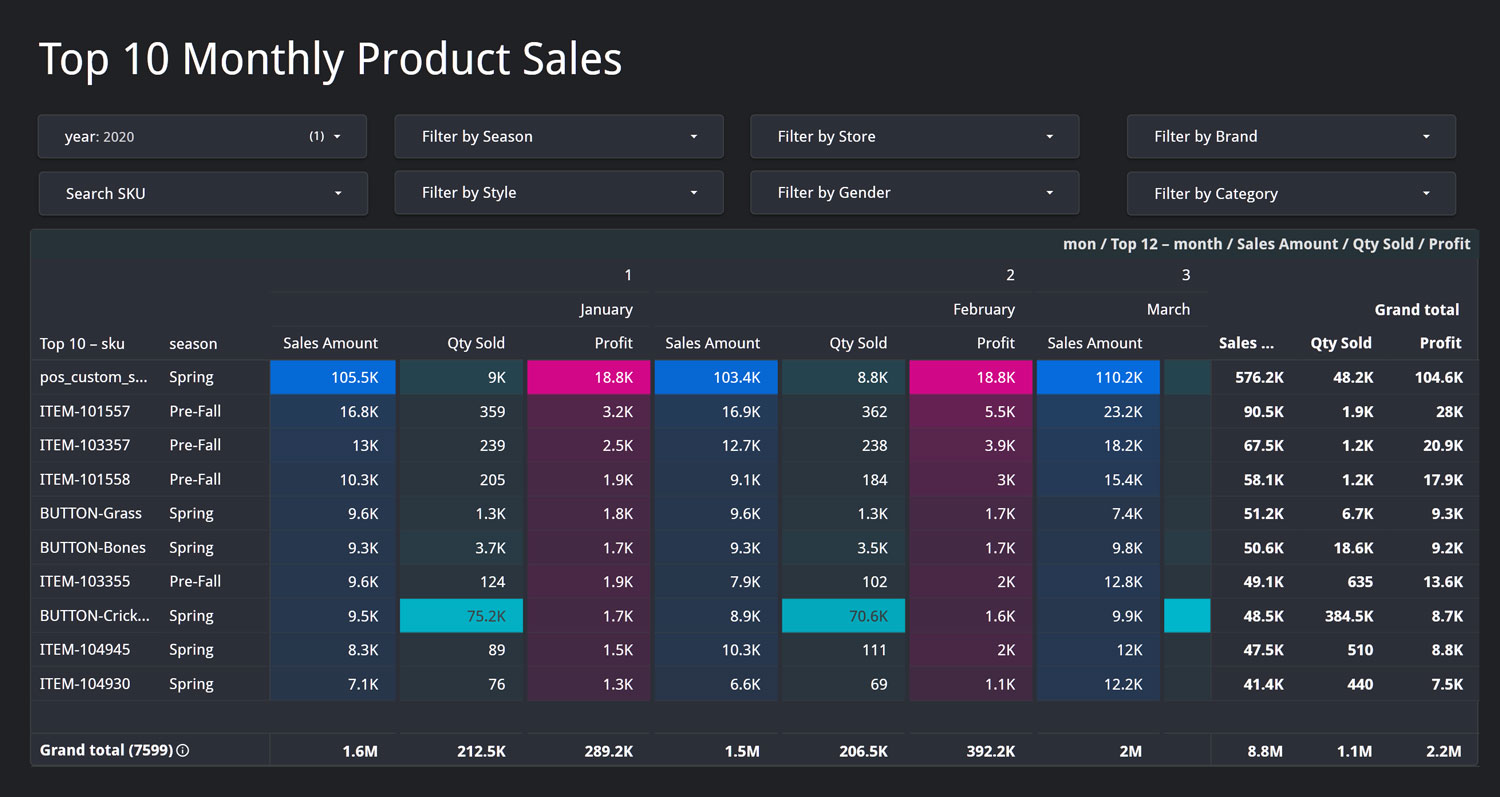
Similar to sales and inventory managers, marketing managers need to track the performance of product categories. Based on the data, you can identify new product trends and promotional strategies for the best selling and underselling categories.
This marketing report should help managers filter by time, product, brand, and store.
Metrics
Product category report should include the following metrics:
- Quantity sold
- Gross sales
- Cost of goods sold
- Margin
- Returns
Check out our chapter on sales manager reports for more information on each metric.
Marketing analysis example
You see that the margin for one category is significantly higher compared to the same day last year.
While the cost of goods remains stable, there’s an increase in sales from stores that are running promotion programs. This means that the in-store promotions are working, so the sales quantity was higher than normal.
The next step is to make sure that the promotion program is still attracting customers, and the store has enough items to sell. You can also design new promotions to maintain customer engagement high even after the current program ends.
Conclusion
A retailer’s marketing strategy contributes greatly to its sales results, customer experience, and brand perception. To optimize marketing activities, managers must monitor 5 crucial marketing reports:
- Marketing dashboard
- Discount report
- Customer report
- Customer loyalty report
- Product category report
The details and insights of your marketing reports might vary based on your industry, size, your marketing objectives, as well as your POS system. However, if you’re a Magento merchant looking for customized retail reports, you can talk to us and get a free consultation on a POS reporting solution.