POS Report Guide Chapter 2
Top 5 sales manager reports to monitor & boost performance
Sales managers aren’t just responsible for the success and failure of a sales team, but also play a key role in the overall health of a retail business. This means you’ll spend a lot of time working with reports to justify your performance. However, many sales managers find it difficult to make sense of the huge amount of data they’ve been given.
This chapter identifies the most common concerns of sales managers, and the top 5 sales reports that you can use to track and improve your sales activities.
This chapter includes 3 key points:
Sales manager role and duties
Retail sales managers are responsible for day-to-day operations and overseeing the sales team. They work with other departments to set sales targets, build a plan to achieve those targets, and analyze sales data to improve sales efficiency. Sales managers recruit salespeople, mentor the team, and evaluate staff performance to help them grow.

Depending on the industry and scale, sales managers in a retail business can take on different responsibilities. Here are some common duties and concerns of a sales manager:
Finance
- Achieve monthly, quarterly, and yearly sales targets
- Look for ways to increase sales and maintain sales budget
- Prepare cost analysis and profit calculations and reports
Operation across all sales channels
- Monitor store displays, merchandise, and presentation
- Track inventory levels and replenish merchandise
- Plan discount, promotion, and advertising campaigns
- Improve customer experience and handle customer complaints
Human resources
- Prepare schedule and assign duties to staff
- Recruit and hire new salespeople
- Coach and mentor retail sales associates with one-on-one meetings and training programs
Why sales managers need POS reports
The success or failure of a retail business depends on the sales team’s ability to bring in revenue from its products and services. Sales manager’s biggest concern is the bottom line, and they can’t make decisions based on guesswork or gut feelings.
Sales manager reports are must-have tools to make strategic decisions. Data from POS reports help you answer key questions about your business operations, including:
- Are we on track to achieve the company’s sales targets?
- How are our profits and margin?
- What are our best-selling products and do we have enough stock in-store?
- Which stores are doing well? What triggers the sales in these stores?
- Which employees are doing well and which ones are struggling?

By analyzing your sales activities, sales managers can understand how the retail is doing, and identify key trends and areas that can be improved. Sales analytics make your team’s progress more transparent and communication between departments easier. Besides, you can pass this information to your sales representatives, and help them sell better.
Top 5 sales manager reports
Sales managers have a lot of responsibility and communicate with many stakeholders. To run sales operations smoothly, you’ll need to keep track of crucial reports that give you not just the number but some context and provide a more complete picture of the profit and cost of sales activities.
The top 5 sales manager reports are:
- Sales dashboard
- Sales staff report
- Product performance report
- Product category report
- Sales by location report
We’ll go into details about what each report is, the key metrics, and how to make sense of the numbers.
Sales dashboard
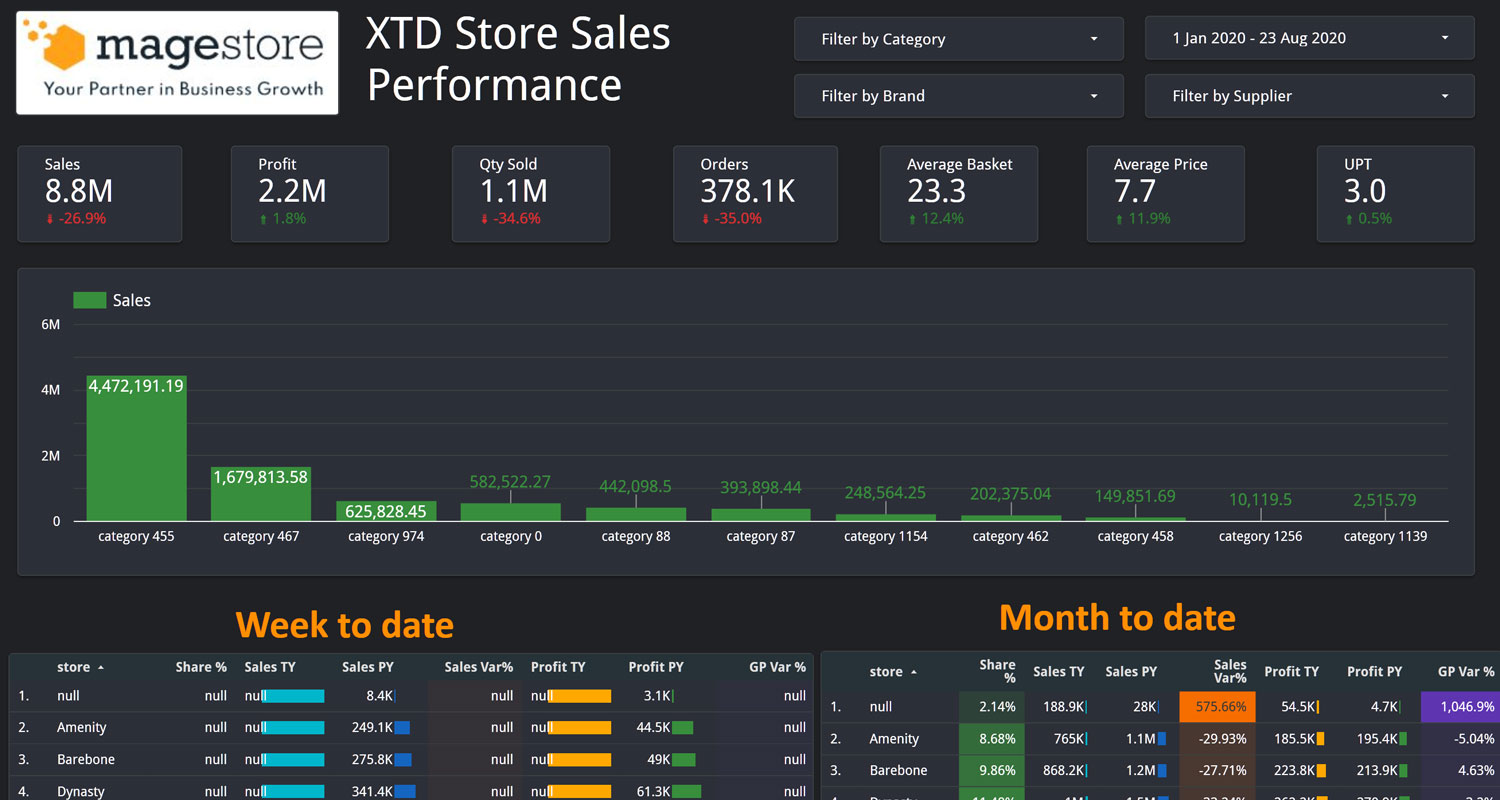
Sample Store Sales Performance report on Google Data Studio by Magestore
Sales data is at the forefront of every retailer’s mind. While everyone in the business benefits from a sales dashboard, sales managers need it for day-to-day operations.
Sales dashboard provides a visualization of the team’s progress towards revenue targets. Sales managers can access the most important sales metrics at a glance and:
- Know the health of sales across channels over time
- Measure customer interest and identify areas that need improvement
- How quickly the team can achieve the goals and decide how to speed up or slow down the sales process
A sales overview report should allow managers to filter by time range, channel, store, category, and product.
Metrics
A sales summary report should include numbers such as gross sales and discount, as well as the cost of goods sold and margins. This way, sales managers can have a better understanding of how much money is going back to the retail business.

Here are the key metrics on a sales dashboard:
Gross sales
The total sales for all products and services recorded in a period, without any deductions. For retailers, this is calculated by multiplying the quantity of products sold by sales price.
Gross sales is an indicator of growth, for they tell sales managers how much and how fast they’re selling.
Sales margin
Sales margin helps sales managers identify the profit your business makes on the sale of a product or service.
To calculate margin, subtract the costs of the sales from the gross number. The costs for retailers usually include discounts, cost of goods, and commissions.
Discount
Price reduction for items based on products, customers, and so on. Sales managers need to keep track of discounts to measure how effective your promotions are and ensure that the business doesn’t end up losing too much money with discounts.
Quantity sold
Number of products sold within a certain period. Sales managers can see which products are selling well, and at which locations.
Refund
Product returns from your customers. Sales managers should track refunds to identify potential issues with products or locations, and ways to improve customer satisfaction.
Other metrics
In addition to the 5 key metrics, sales summary reports can also include receivable amount, tax amount, basket size, basket value, transaction count.
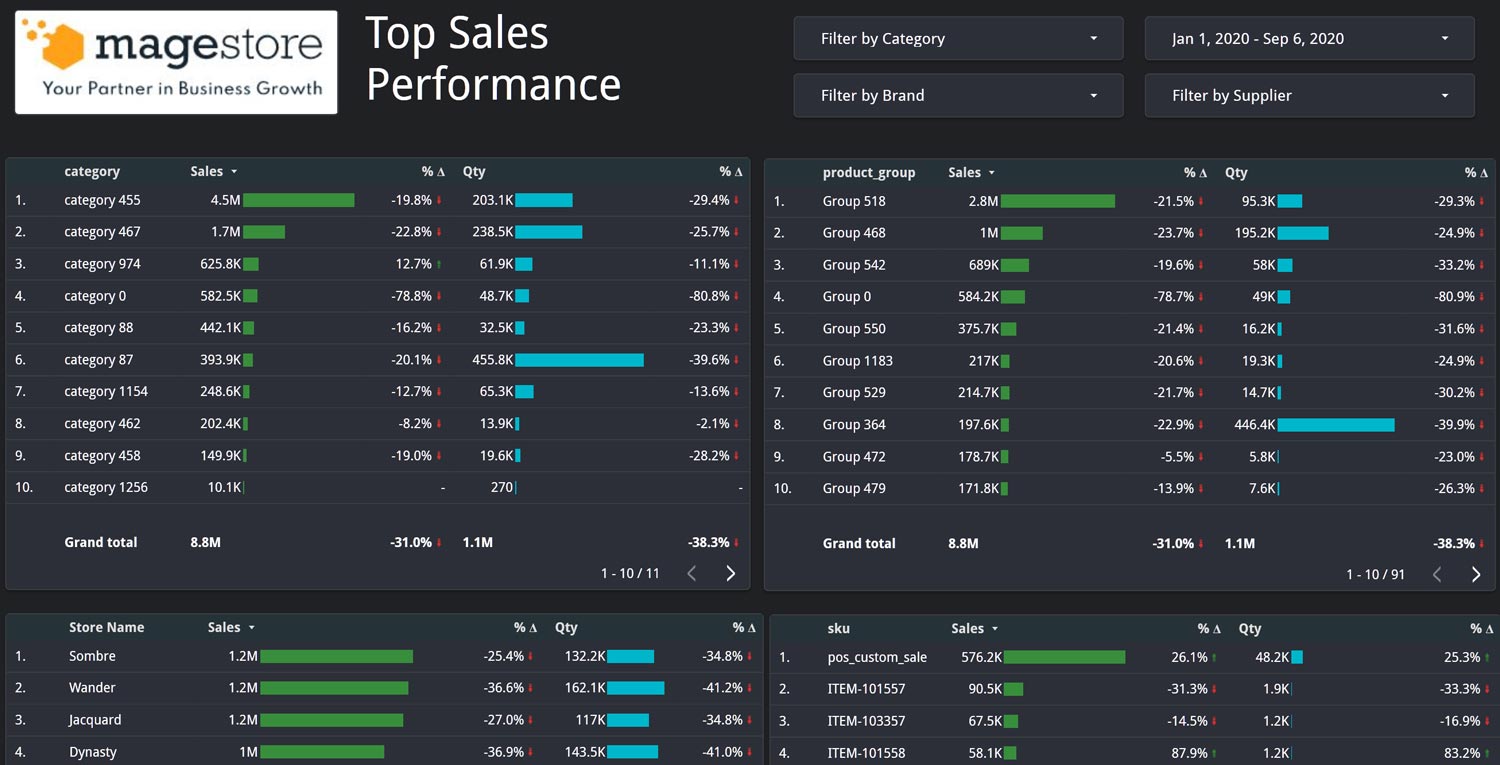
Top sales performance sample by Magestore
The metrics from the dashboard can give you a snapshot of all sales activities. Let’s have a look at an example to see how we can make sense of these numbers.
Sales analysis example
Let’s say you see a dramatic decrease in gross sales. As a sales manager, it’s your responsibility to find the reason and improve the situation.
Gross sales number is equal to units sold multiplied by price. Therefore, either the number of products you sold went down, or there’s too much discount on the price. After investigating, you can see that the discount amount actually went down, so it isn’t the problem. The issue here is the drop in quantity sold.
The next step is to investigate where the problem lies, and in this case, which sales channel. Some sales reports let you filter by online and offline channels, or you can combine the sales dashboard with website and store sales reports to compare the numbers of each channel.
When you look at the website, you may find that the cart abandonment rate is too high. If this is the case, you’ll need to identify tactics to decrease abandonment rates, such as optimizing checkout experience or implementing email marketing programs.
If your website doesn’t have any problem, the next step is to check offline channels. Investigate the performance of specific stores and identify ways to attract customers to come to these stores to buy products.
Explore solution: Most customizable & scalable POS for Magento merchants
Sales staff report
One of the most important duties of sales managers is to support and motivate your sales team.
Staff performance report gives a snapshot of your entire team’s performance to know which staff are doing their jobs well. It also helps identify the strengths and weaknesses of your employees so you can train them to be more efficient and build the perfect team.

Metrics
Hours worked
Total number of hours your staff spent working, which is often calculated by recording the start and end times for their shifts.
Retailers need this number to pay wages and benefits, but sales managers can also look at this number to identify the team’s needs (or issues), and make staffing decisions.
Sales per hour
The number of sales each employee is responsible for making. The sales per hour metric is calculated by taking the sum of all sales and dividing it by the number of hours worked.
Sales managers can look at this number to see how busy their staff are.
Profit per hour
The profit each sales staff brings to your business every hour. It’s calculated by taking the sum of profits from all sales and dividing by the number of hours worked.
Profit per hour is one of the metrics that help sales managers measure the team’s productivity.
Average basket size
The number of items your staff sells in a single purchase. Retailers calculate this by dividing the total items sold by the number of completed sales for each employee.
Refund
Product returns from your customers. Sales managers should track refunds to identify potential issues with products or locations, and ways to improve customer satisfaction.
Other metrics
To measure staff productivity, sales managers can also look at discount, transaction count, refund, and conversion rate.
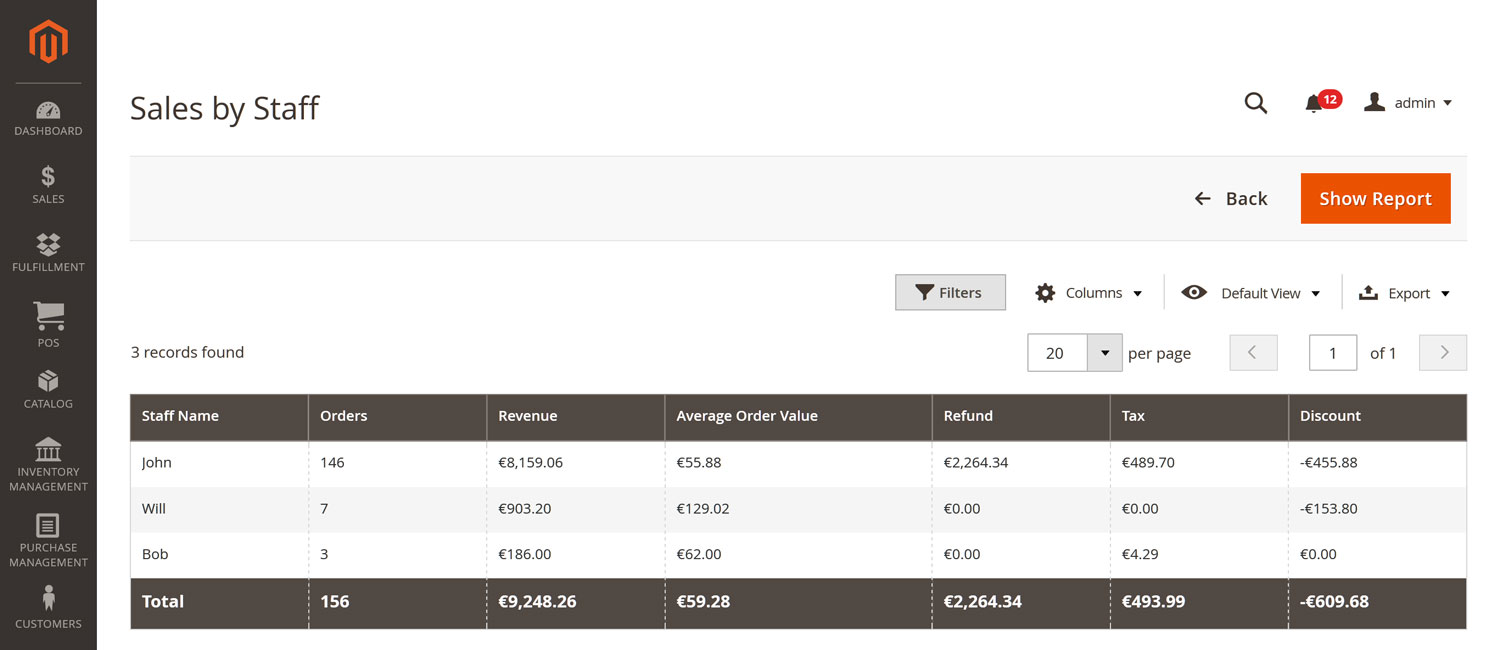
Sample Sales by Staff report in Magento admin by Magestore
This type of sales manager report is particularly useful for coaching. Let’s look at an example to see what decisions can be made.
Sales analysis example
Let’s say you have a new employee with high hours worked, high sales per hour, but low profit per hour.
How can you help them? By looking at the sales report, you see that their average basket size is low. This means that while the staff is good at closing deals (or aggressive enough), they might lack the skill to consult customers on their problems, or don’t know how to build trust so customers would purchase more expensive items.
With the sales data, you can sit down with your staff and review their approach and brainstorm potential ideas to improve the process. If this is a problem for many employees, you can even offer in-house training courses and reward those who complete them.
Product performance report
Product performance is a hybrid between sales and inventory. With this type of sales manager report, you can tell which products are selling well and which aren’t resonating with your customers.
Sales managers can identify new sales opportunities as well as give suggestions for inventory planning.
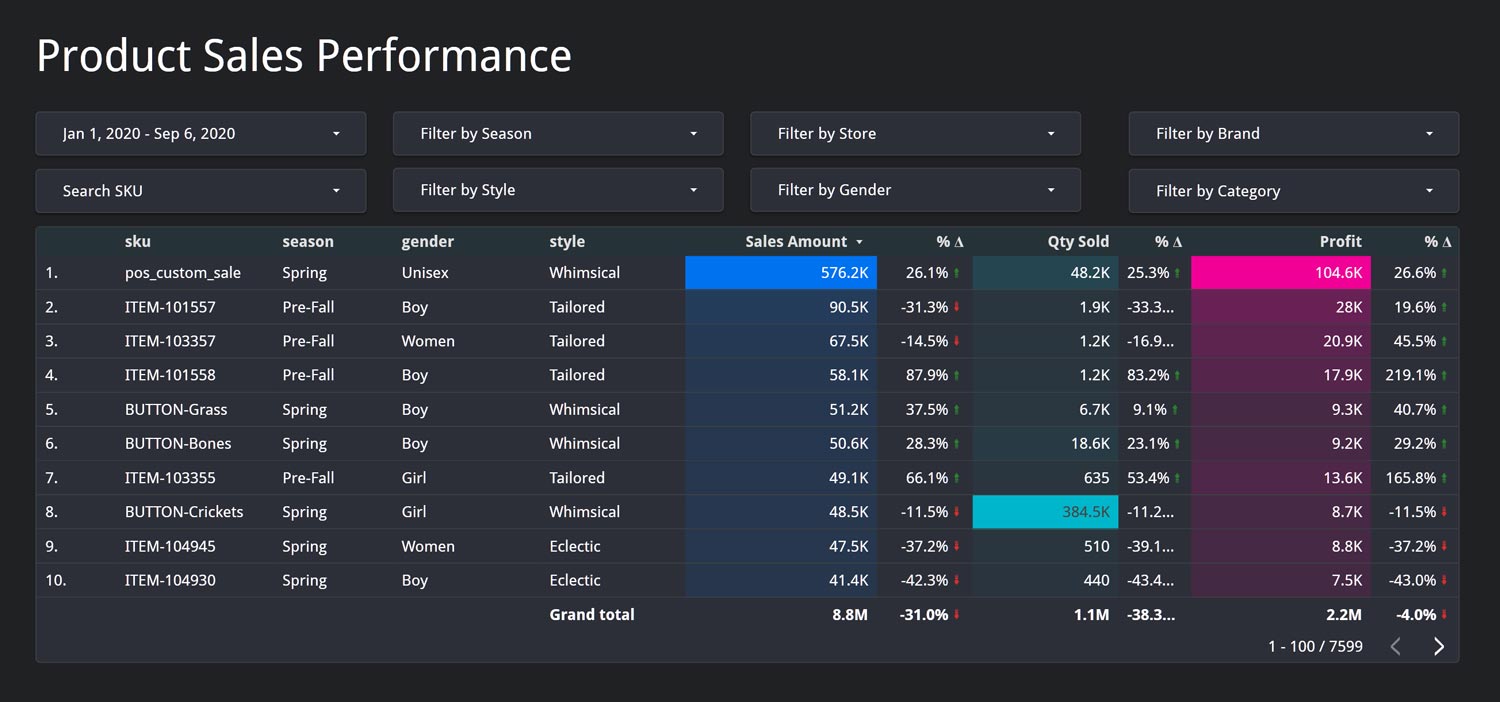
Sample Product Performance report by Magestore
Metrics
Quantity sold
As mentioned in the sales dashboard section, this measures the total number of units of a specific product sold.
Gross sales, discount, and margin
How much sales and profit you get from selling the product. Managers can look at the sales data over time to identify if the product is trending or not and make decisions to promote the product more or run a discount.
Average price
The average price your product is selling for across all channels and promotion programs. For consumer electronics retailers, they can compare this with the industry average to adjust their pricing strategy if necessary.
Inventory on hand
How much stock is available for sales across all channels. By tracking this number, sales managers can propose what to order more and what to cut back to maximize profit.
Other metrics
In addition, sales managers can also track the cost of goods sold, product variants, and returns.
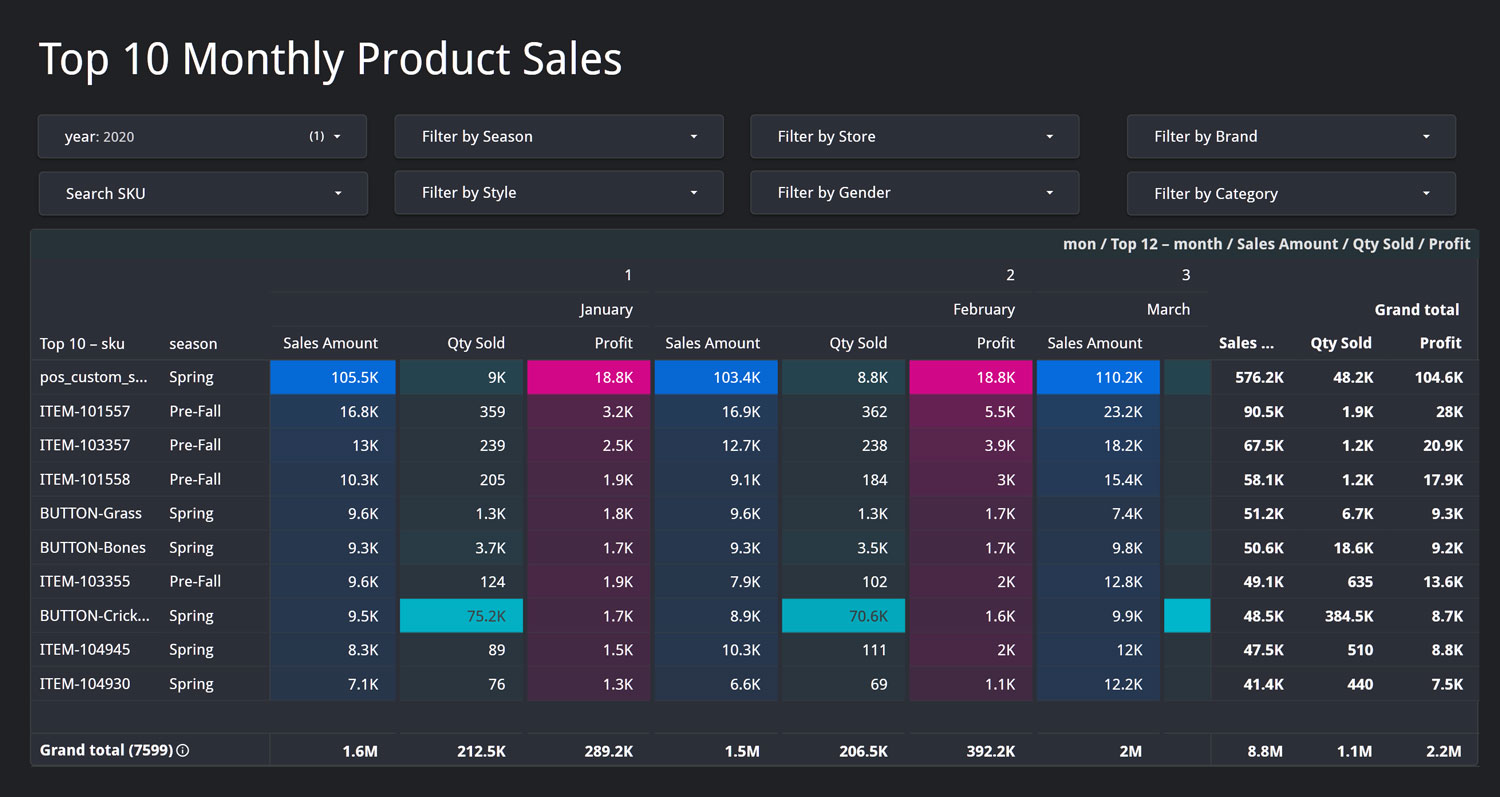
A Top 10 Products Sales report on Google Data Studio by Magestore
Once you’ve identified the broader trends or insights for your product, there’s a lot you can do to create more sales.
Sales analysis example
Let’s say you have a product with high average price, high revenue, but low quantity sold, and high inventory. Based on the numbers, you can work with your sales team to introduce the item more often when talking to the customers, and display the item in a more eye-catching place in the stores.
On the flip side, if you see a product that isn’t performing well, then you can discuss possible promotions with the marketing managers. You can run an end-of-season discount or combine the product with complementary items to create package deals.
Product category report
Sales by category report helps sales managers tell how much profit comes from each product or service category. This sales manager report highlights the most profitable categories for your business, so you can decide how to position and promote your products.
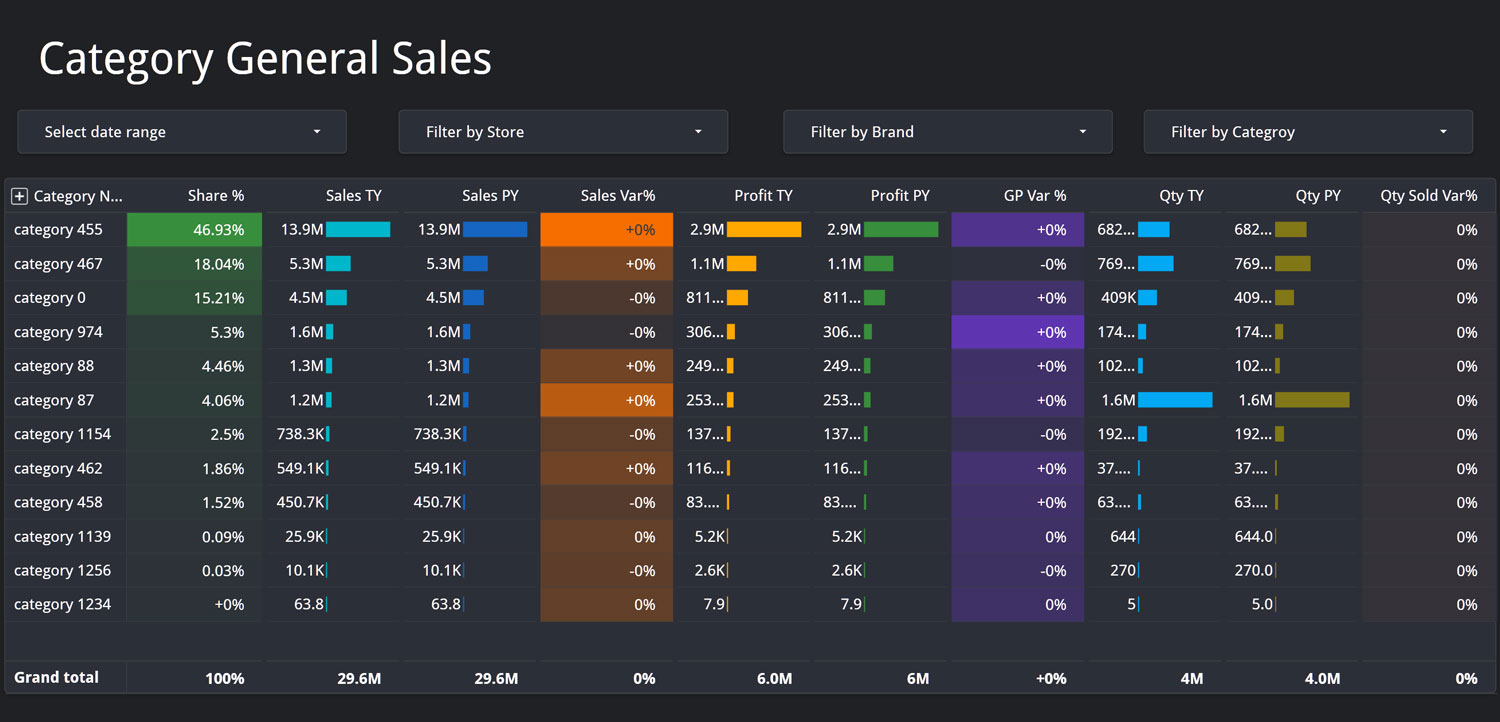
Product Category Sales report on Google Data Studio by Magestore
Metrics
Quantity sold
The total number of products sold for each category. Sales managers can look at the report and see how fast each category is selling.
Cost of goods sold
All costs and expenses related to the production of all items in the category. Sales managers can track the cost of goods sold along with quantity sold and margin to make suggestions on inventory planning.
Margin
How much profit you get from different categories. If quantity sold tells sales managers how fast a category is selling, margin lets sales managers know which categories are the most profitable.
Other metrics
To analyze category performance, sales managers can also track the discount, and returns.
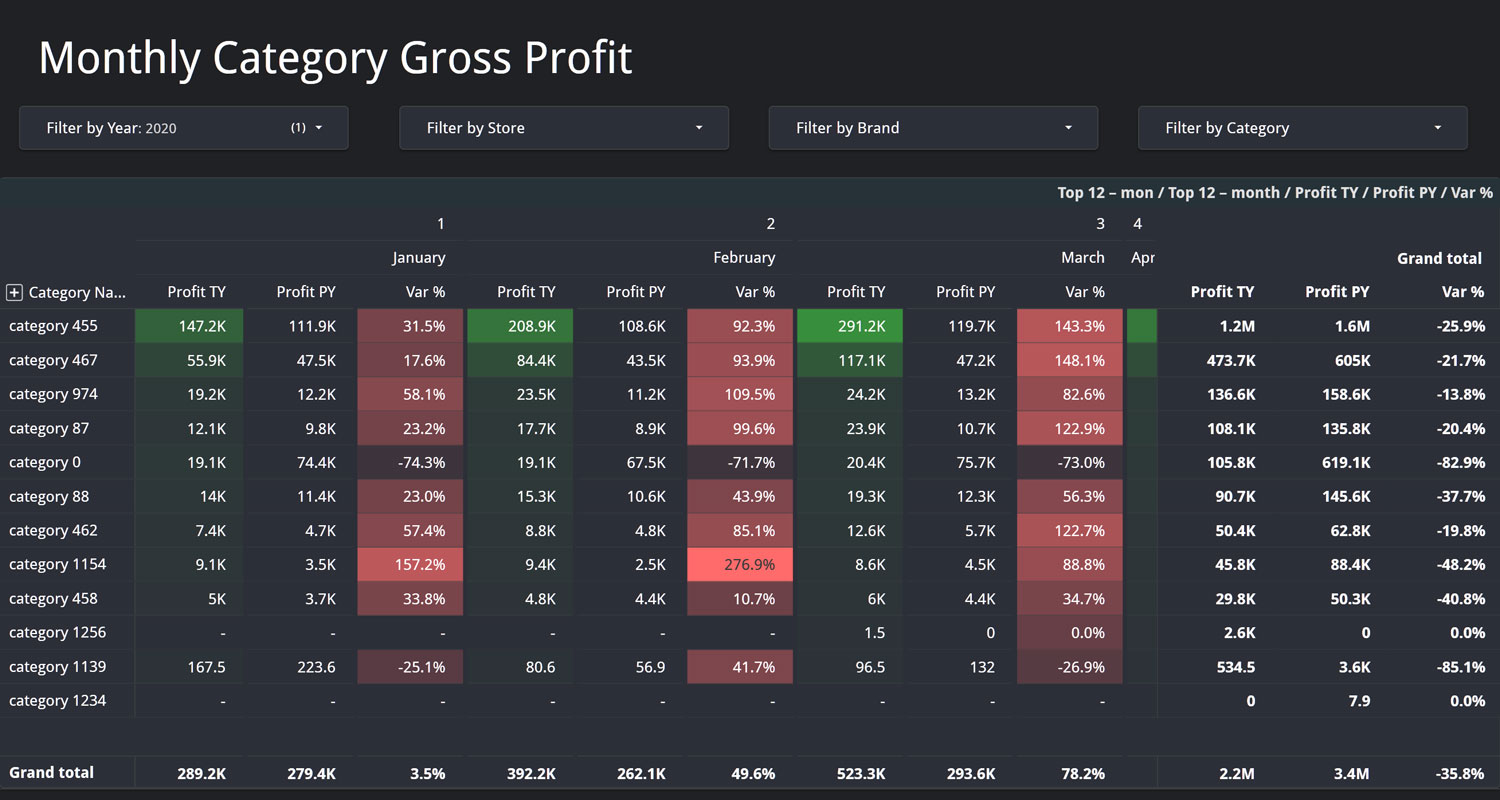
Product Category Profit report on Google Data Studio by Magestore
Sales managers can track sales by category report over time to identify trends and potential issues. Let’s look at some examples.
Sales analysis example
You see that the sales of a category decreased compared to the same day last year. When checking across categories, you realize sales for all categories went down in-store, due to bad weather over the week.
If the weather conditions won’t improve this week, there will be fewer customers coming to the store. Therefore, sales managers can propose free home delivery for big orders, and better prices for website orders.
Sales by location report
The location performance report lets sales managers view and compare the sales performance of all stores. With this sales manager report, you can better understand how an outlet holds up against another.
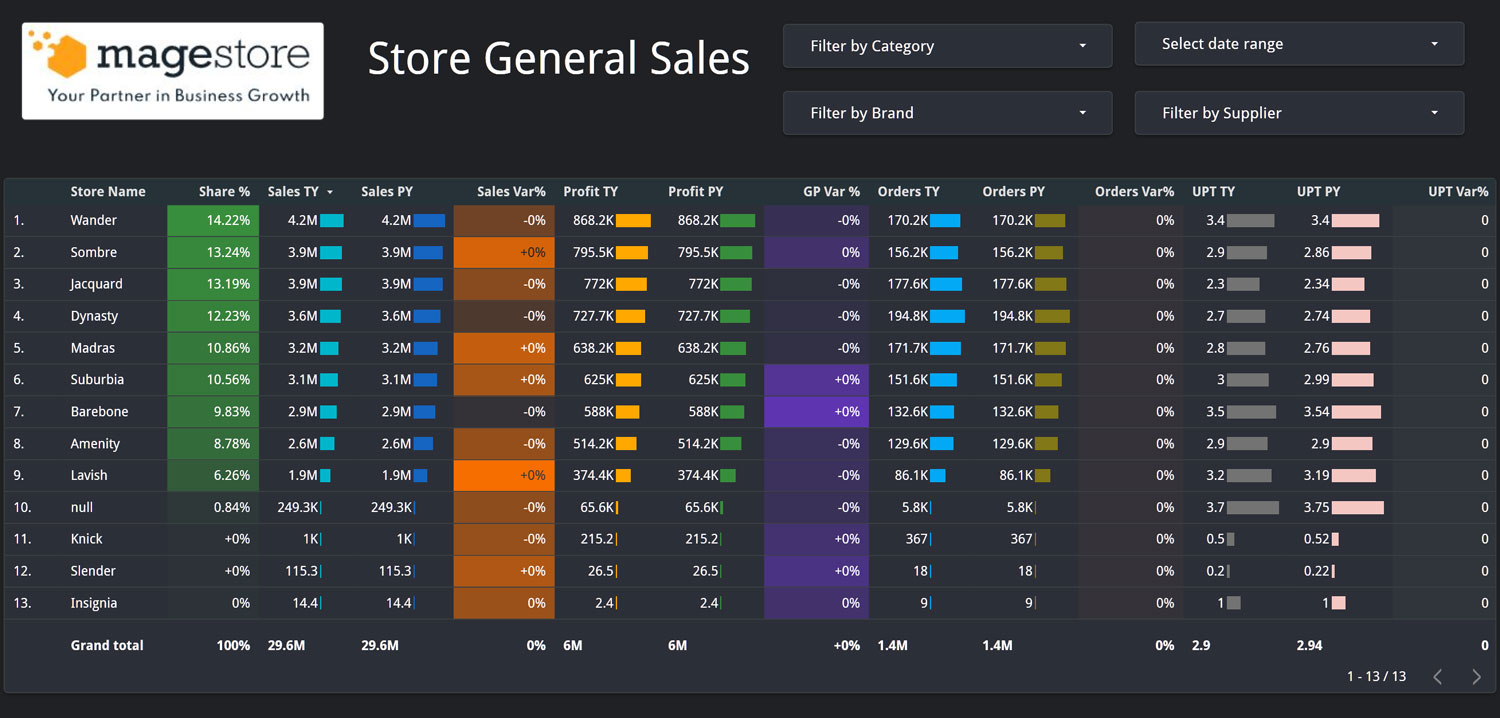
Store General Sales report on Google Data Studio by Magestore
Metrics
Orders count
Number of sales transactions at each location. This helps sales managers see how busy each of your stores is.
Gross sales
The total sales at the location, without any deductions.
Cost of goods sold
All costs and expenses related to the production of all items in the location.
Discount
Total discount applied to sales, minus the returns.
Refund
Product returns in each of the locations.
Margin
How much of the sales in each store is contributing to the profit of the retail business.
Other metrics
Location performance reports can also include number of customers, retail conversion rate, or sales per square foot.
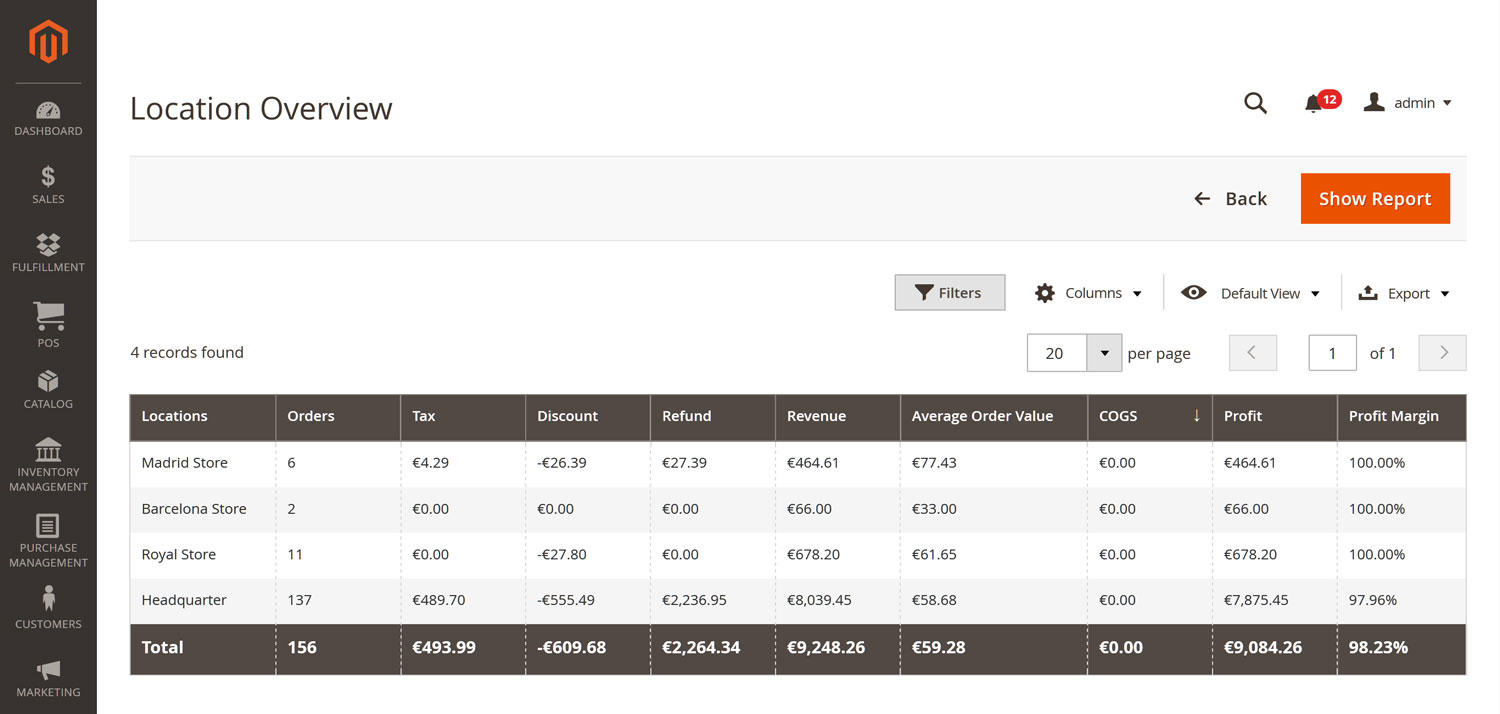
Magestore’s Location Overview report in Magento backend
Sales analysis example
Imagine a scenario where you have a store with a lower than average margin. Its gross sales are smaller than usual and discount higher. Combining this with the product reports, you find out that some key products are being sold at big discount prices, and these products have contributed to a large percentage of the store’s profit in the past.
Since the promotion is running until the end of the month, the products will continue to have low margin. The best course of action is to continue selling more of these products, but also displaying related products nearby to cross-sell and increase margin.
Conclusion
Sales managers are responsible for many business results in terms of finance, operation, and human resources. To manage all activities effectively, sales managers should keep their eye on 5 crucial reports:
- Sales dashboard
- Sales staff report
- Product performance report
- Product category report
- Sales by location report
Based on the retailer’s industry, size, and POS system, the level of details and insights of these sales manager reports might differ. However, if you’re a Magento merchant looking for customized retail reports, you can talk to us and get a free consultation on a POS reporting solution.
Best Retail POS System
Optimize your business operations with our complete POS for Magento
- Sell online or in your physical stores seamlessly with real-time data synchronization.
- Sell everywhere from one platform with desktop or iPad devices, even without internet connection.
- All data stay safely on your Magento website, and your POS doesn’t have to rely on third-party servers to work.